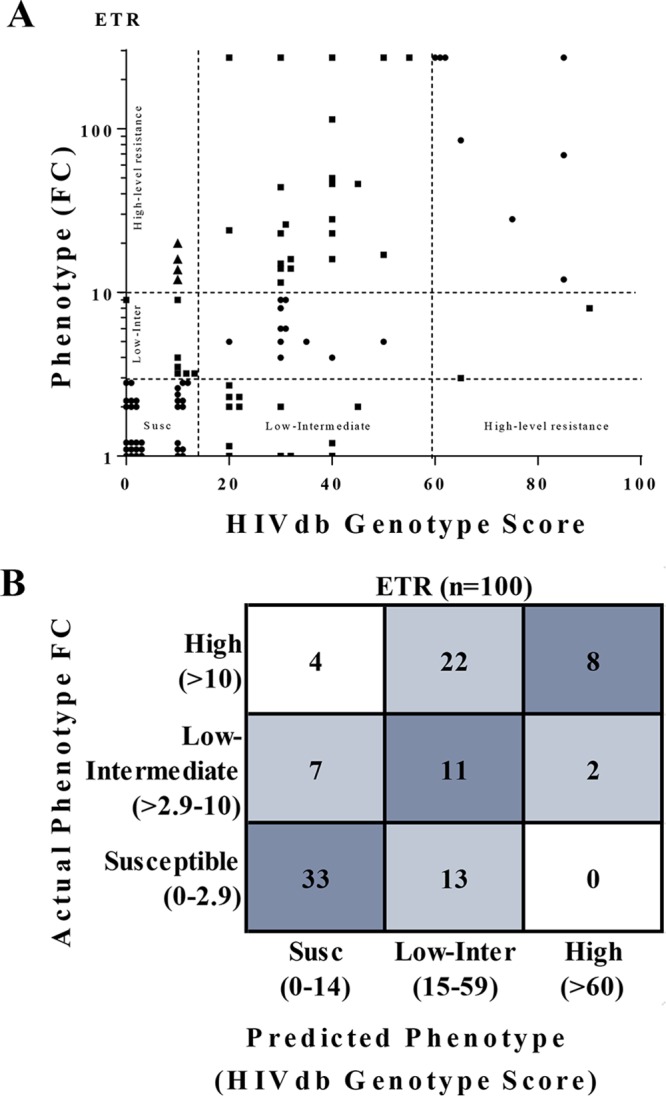
FIG 2.

Comparison of ETR phenotype to genotype-based predicted phenotype. (A) ETR phenotype (fold change in EC50) does not strongly correlate with HIVdb score (r = 0.47) for HIV-1 subtype C isolates. Results show 52% of genotype scores were concordant (●, classifications matching), 44% were partially discordant (■, HIVdb predicted 1 classification different), and 4% were completely discordant (▲, HIVdb predicted 2 classifications different) relative to the phenotype clinical cutoffs. (B) Error matrixes of actual fold phenotypic resistance versus predicted resistance for ETR. More samples (26/100) with high phenotypic ETR resistance (FC >10) were misclassified as having low or intermediate resistance. GTR-IS scores were determined using the HIVdb v8.4.
