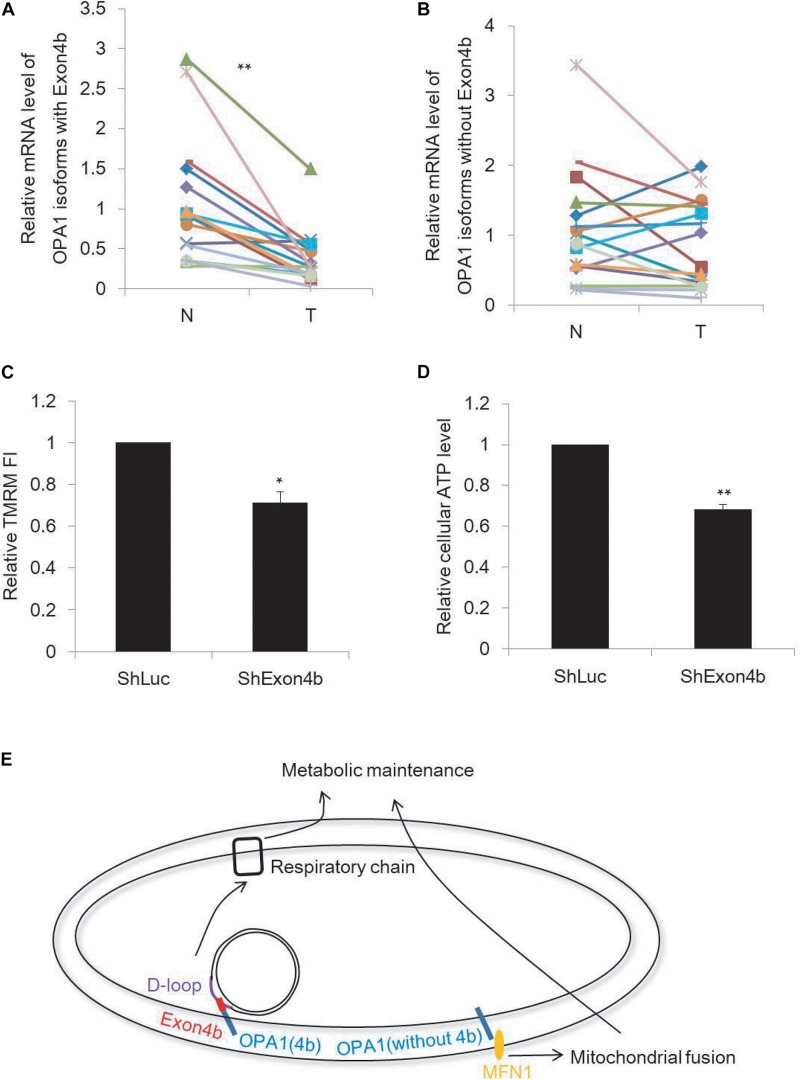
FIGURE 5.
Downregulation of Exon4b-containing OPA1 isoforms in HCC. (A,B) mRNA levels of OPA1 isoforms with Exon4b (A) and OPA1 isoforms without Exon4b (B) in 22 paired HCC (T) and adjacent non-tumor (N) liver tissues (n = 22, paired-samples t-test **p < 0.01). (C,D) Relative TMRM fluorescence intensity (FI) (C, n = 3, biological replicates) and cellular ATP level (D, n = 3, biological replicates) in SK-Hep1 cells expressing ShExon4b compared to that in SK-Hep1 cells expressing ShLuc which is normalized to 1 (independent-samples t-test. *p < 0.05, **p < 0.01). (E) Model of the functions of OPA1 isoforms with or without Exon4b.

