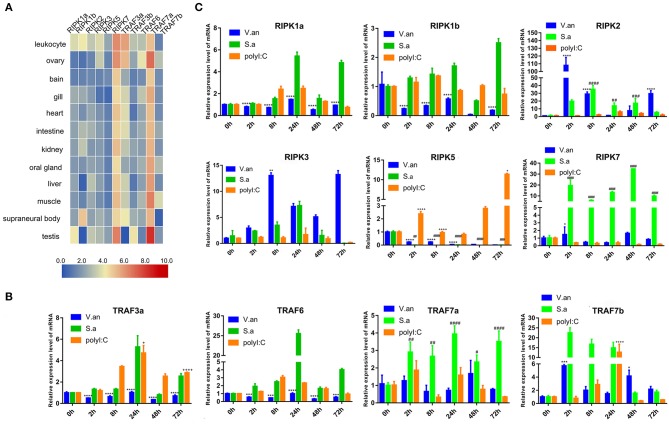
Figure 7.
Expression profiles of lamprey RIPK and TRAF family genes. (A) Expression of ripk and traf genes in lamprey tissues. Original data from the database, data value represent reads per kilobase of transcript per million (RPKM). Q-PCR analysis of trafs (B) and ripks (C) in lampreys to characterize mRNA expression levels in leukocytes at 0, 2, 8, 24, 48, and 72 h after treatment with V. anguillarum, S. aureus and Poly I:C. All of the data are presented as the means ± SDs based on three independent cDNA samples with three replicates per sample. The asterisks indicate significant differences (n = 3, **P < 0.01 and *P < 0.05) compared to the control. The * represents statistical comparison between V. anguillarum stimulation group and control group. The # represents statistical comparison between S. aureus stimulation group and control group. The + represents statistical comparison between Poly I:C stimulation group and control group.

