
Figure 3. Number of countries that changed double burden of malnutrition* status from 1990s to 2010s, by GDP/capita (PPP) quartile.
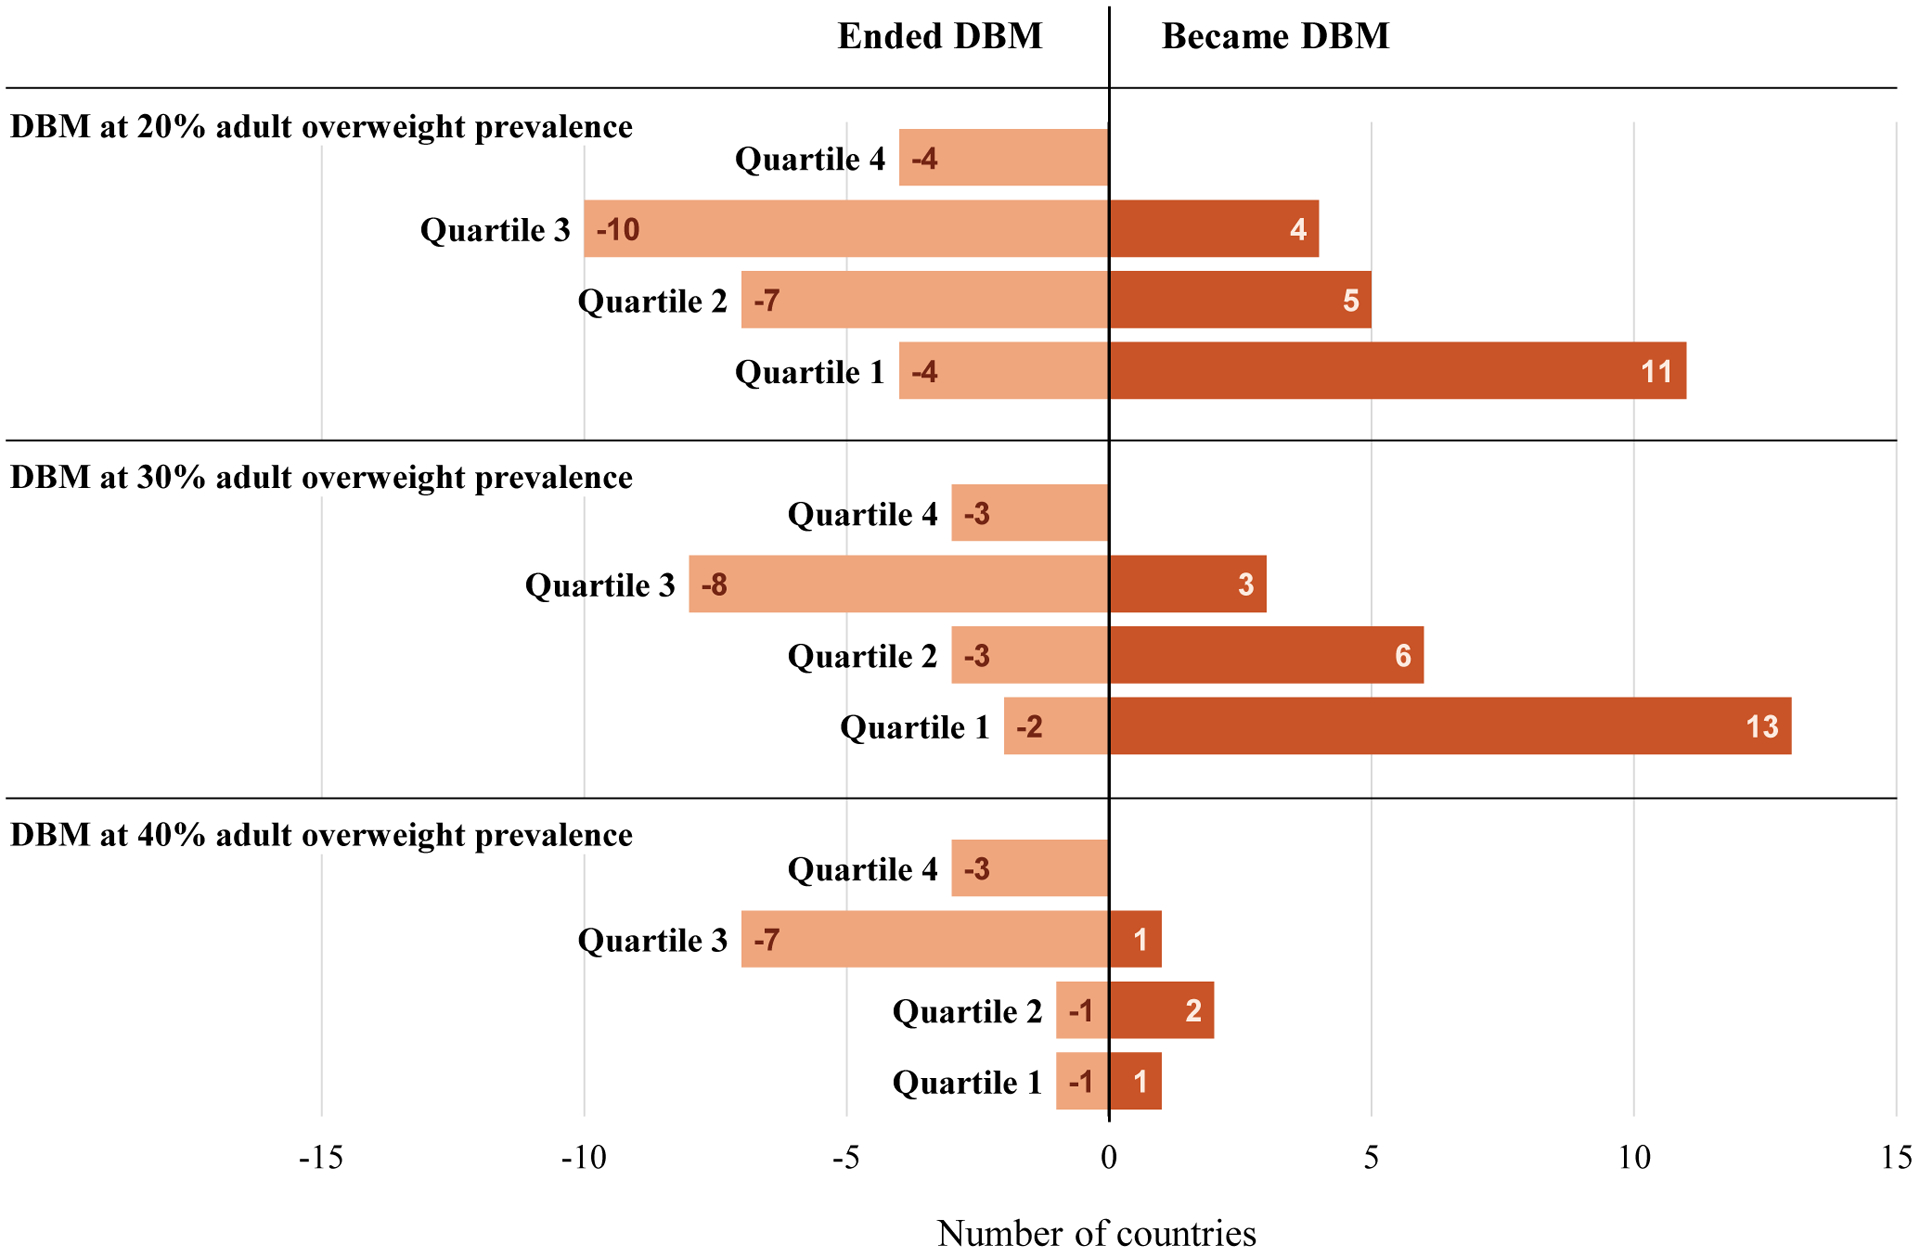
* Double burden of malnutrition (DBM) = at least 1 child, adolescent, or adult in household with severe levels of wasting/stunting/thinness and 1 with overweight/obesity(shown at 20%, 30%, or 40% adult overweight prevalence); countries only included here if they had DBM data available for bothtime periods (1990s and 2010s)
** Quartile (Qtl) 1 is lowest-wealth, Qtl4 is highest-wealth
Data sources: Based on UNICEF, WHO, World Bank, and NCD-RisCestimates supplemented with selected DHS and other country direct measures for the 1990’s