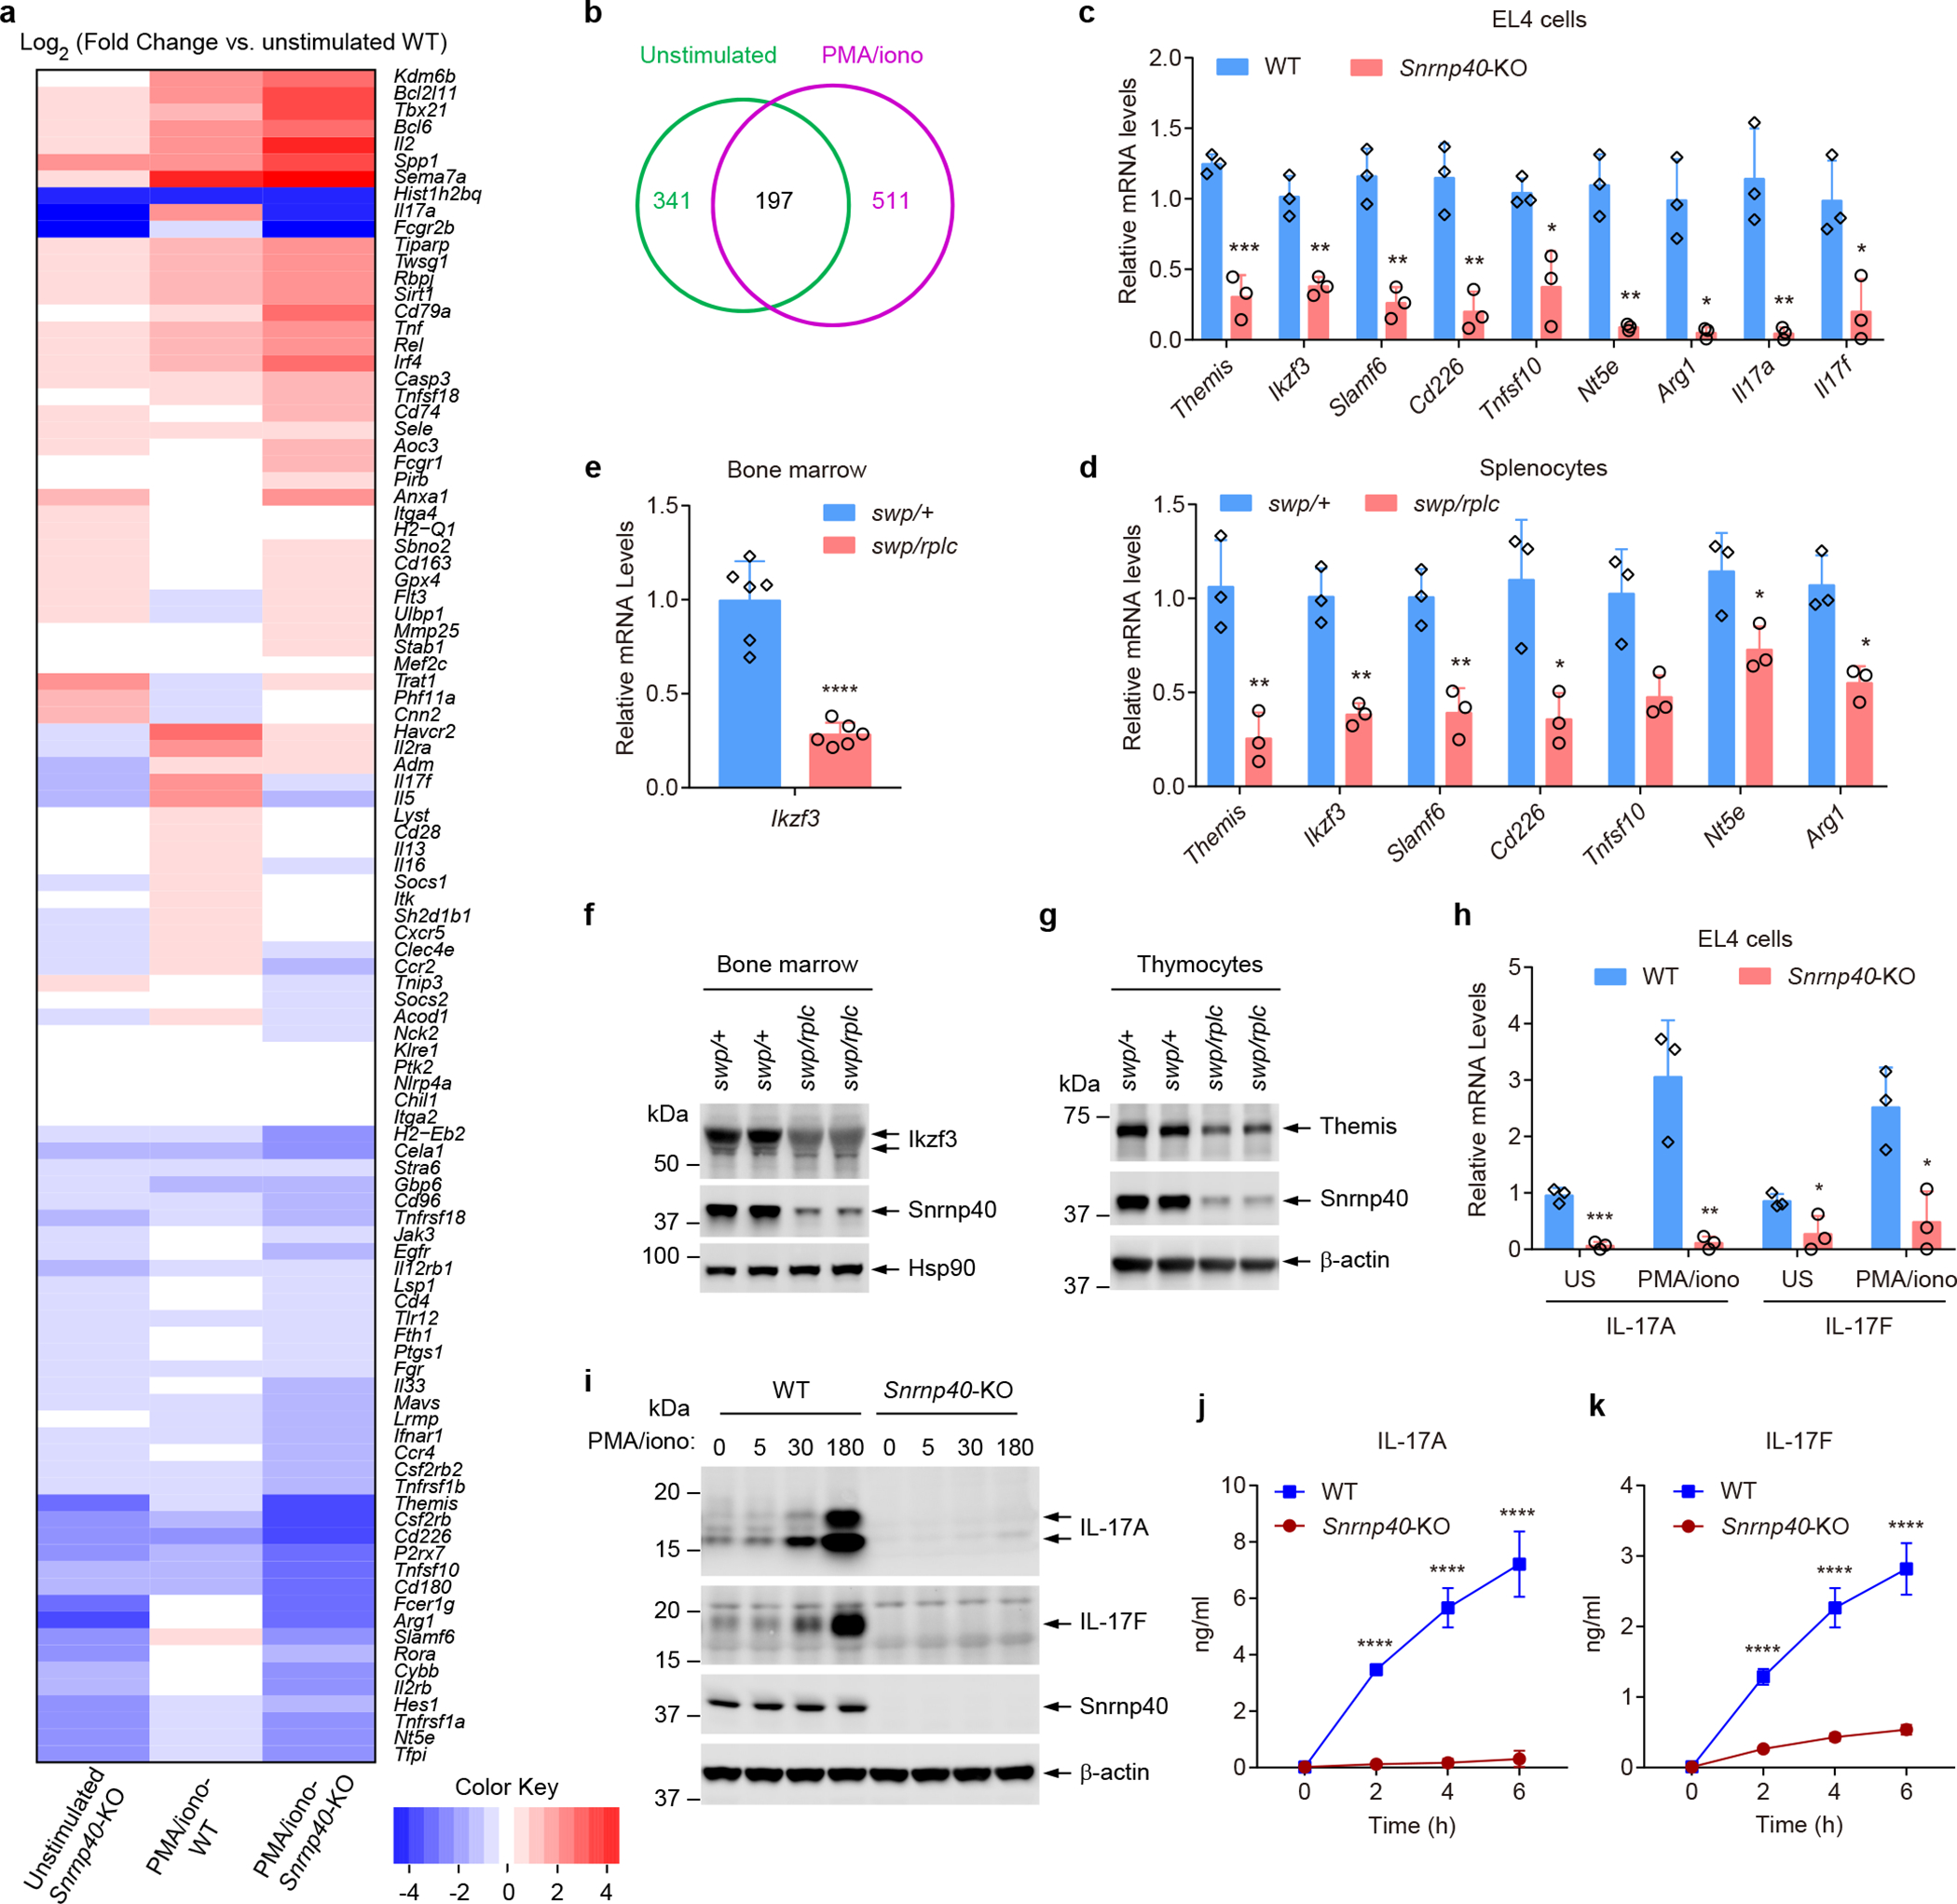
Figure 7. Diminished expression of mRNAs and proteins with immune system functions in Snrnp40-KO EL4 cells.

a, Heatmap for differentially expressed immune genes in unstimulated or PMA/ionomycin stimulated Snrnp40-KO and wild-type EL4 cells. Data represent Log2 of fold change vs. unstimulated WT. b, Venn diagram for 655 unique differentially expressed genes. 30.0% (197) were affected in both unstimulated and stimulated conditions. c, RT-qPCR analysis of the indicated mRNAs in Snrnp40-KO and wild-type EL4 cells (n=3 independent cell lines per group; ***P=0.00063, **P=0.0024, **P=0.0023, **P=0.0043, *P=0.014, **P=0.0014, *P=0.01, **P=0.0062, *P=0.044, unpaired, two-tailed Student’s t-test). d, RT-qPCR analysis of the indicated mRNAs in Snrnp40swp/+ and Snrnp40swp/rplc splenocytes (n=3 mice per genotype; **P=0.0080, **P=0.0025, **P=0.0058, *P=0.021, *P=0.022, *P=0.039, **P=0.0078, unpaired, two-tailed Student’s t-test). e, RT-qPCR analysis of Ikzf3 in Snrnp40swp/+ and Snrnp40swp/rplc bone marrow (n=6 mice per genotype; ****P<0.0001, unpaired, two-tailed Student’s t-test). f,g, Immunoblot analysis of Ikzf3 expression in bone marrow (f) and Themis expression in thymocytes (g) of Snrnp40swp/+ and Snrnp40swp/rplc mice. h, RT-qPCR analysis of Il17a and Il17f in unstimulated (US) and PMA/ionomycin (50 ng/ml PMA and 1 μg/ml ionomycin) stimulated Snrnp40-KO and wild-type EL4 cells (n=3 independent cell lines per group; ***P=0.00045, **P=0.0073, *P=0.041, *P=0.016, unpaired, two-tailed Student’s t-test). i, Immunoblot analysis of IL-17A and IL-17F expression in Snrnp40-KO and wild-type EL4 cells at indicated time points after PMA/ionomycin stimulation. j,k, Concentration of IL-17A (j) and IL-17F (k) in the supernatants of Snrnp40-KO and wild-type EL4 cells (n=3 independent cell lines per group) at different time points after PMA/ionomycin stimulation. ****P<0.0001, two-way ANOVA with Sidak’s multiple comparisons test). RNA-seq experiment was performed one time (a,b). Data are representative of two (c-e,j,k) or three (f-i) independent experiments (mean ± s.d. in c-e,h,j,k). Quantities of mRNA are expressed relative to Gapdh transcript level (c-e,h). The blots (f,g,i) were cropped to show relevant bands and their original images are presented in the Source Data.
