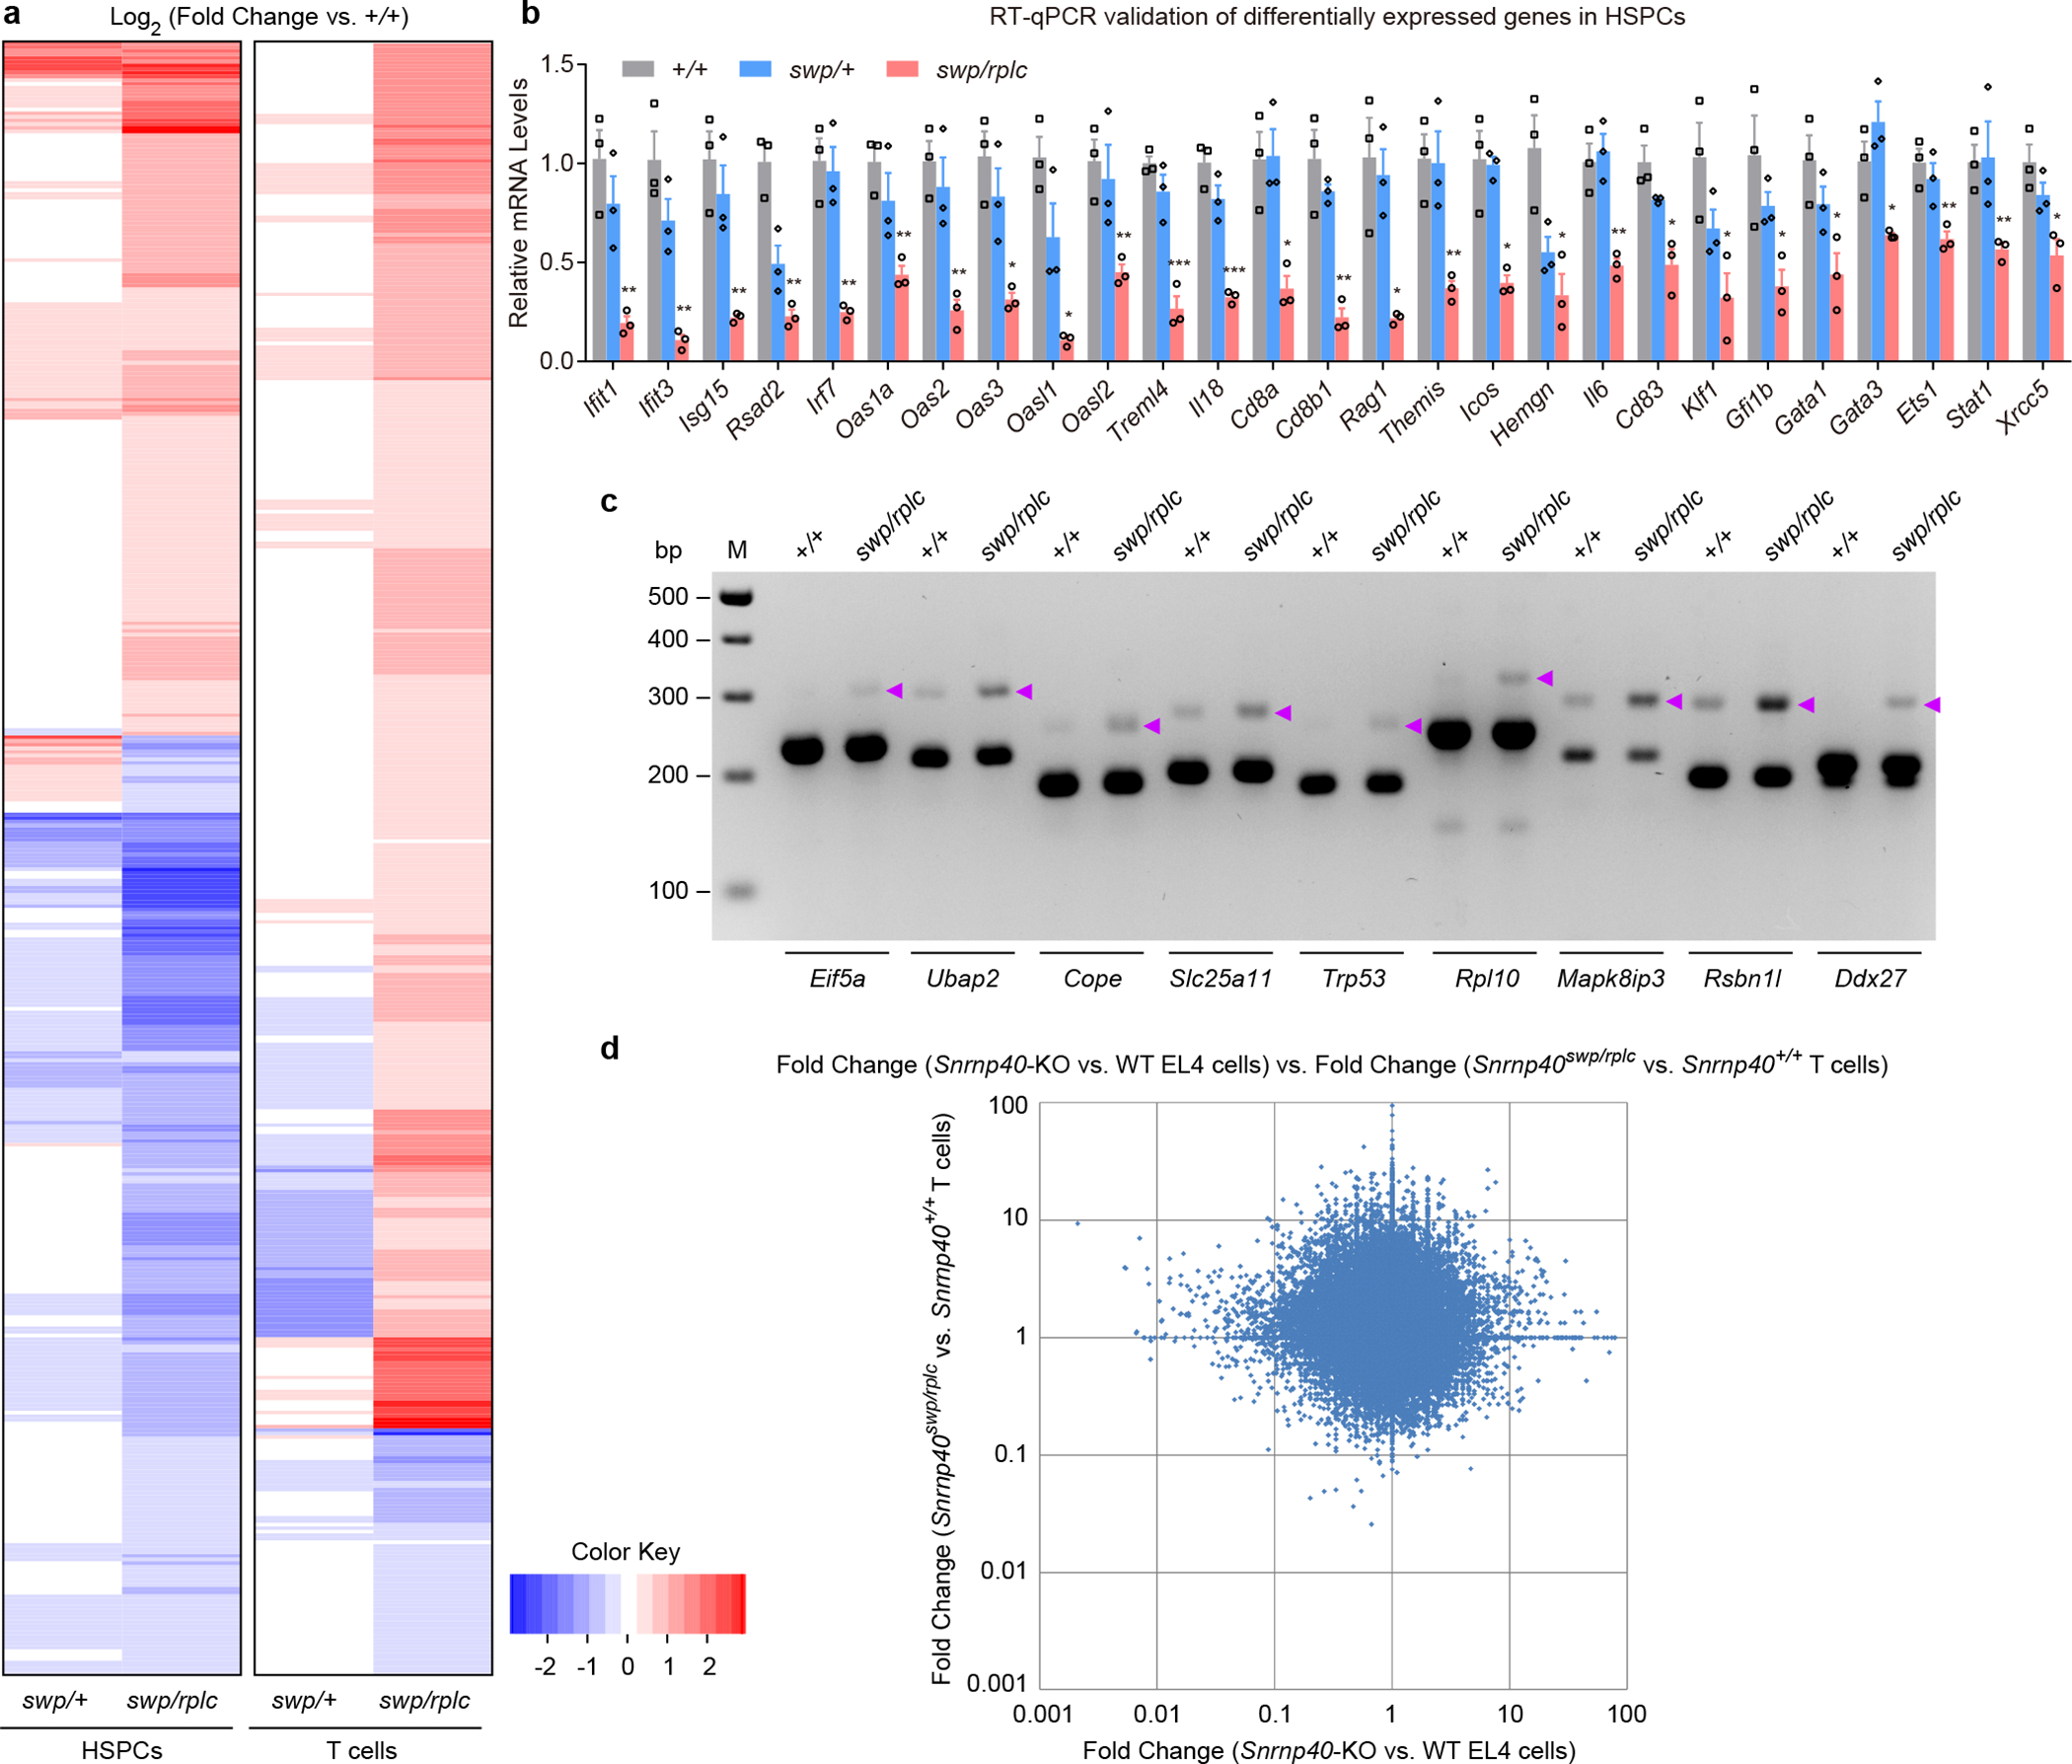
Figure 8. Impaired splicing and transcript expression in primary Snrnp40swp/rplc HSPCs and T cells.

a, Heatmap for differentially expressed immune genes in HSPCs and T cells. b, RT-qPCR analysis of the indicated mRNAs in Snrnp40+/+, Snrnp40swp/+, and Snrnp40swp/rplc HSPCs (n=3 mice per genotype). Data are mean ± s.e.m.; P values (Snrnp40+/+ vs. Snrnp40swp/rplc HSPCs) were determined by unpaired, two-tailed Student’s t-test. **P=0.0051, 0.0033, 0.0049, 0.0013, 0.0027, 0.0040, 0.0029, *P=0.018, 0.013, **P=0.0082, ***P=0.00051, 0.00061, *P=0.013, **P=0.0063, *P=0.020, **P=0.0069, *P=0.013, 0.049, **P=0.0061, *P=0.011, 0.029, 0.038, 0.025, 0.021, **P=0.0081, 0.0088, *P=0.018. Quantities of mRNA are expressed relative to Gapdh transcript level. c, RT-PCR analysis of splicing errors resulting in retained introns in Snrnp40+/+ and Snrnp40swp/rplc HSPCs. Retained introns in genes Eif5a, Ubap2, Cope, Slc25a11, Trp53, Rpl10, Mapk8ip3, Rsbn1l, and Ddx27 are shown. Purple arrowheads indicate longer PCR products containing retained introns. d, Comparison between the effect of Snrnp40 mutation on gene expression in EL4 cells vs. the effect in T cells. Differential expression data from EL4 cell and T cell RNA-seq experiments were plotted. The graph shows the fold-changes of exons that were differentially expressed in Snrnp40-KO EL4 cells plotted vs. the fold-changes of the corresponding exons in Snrnp40swp/rplc T cells (R2=0.0002). Fold-changes for each cell type are relative to the corresponding wild-type cells. RNA-seq experiment was performed one time (a,d). Data are representative of two independent experiments (b,c). The gel (c) was cropped to show relevant bands and it original image is presented in the Source Data.
