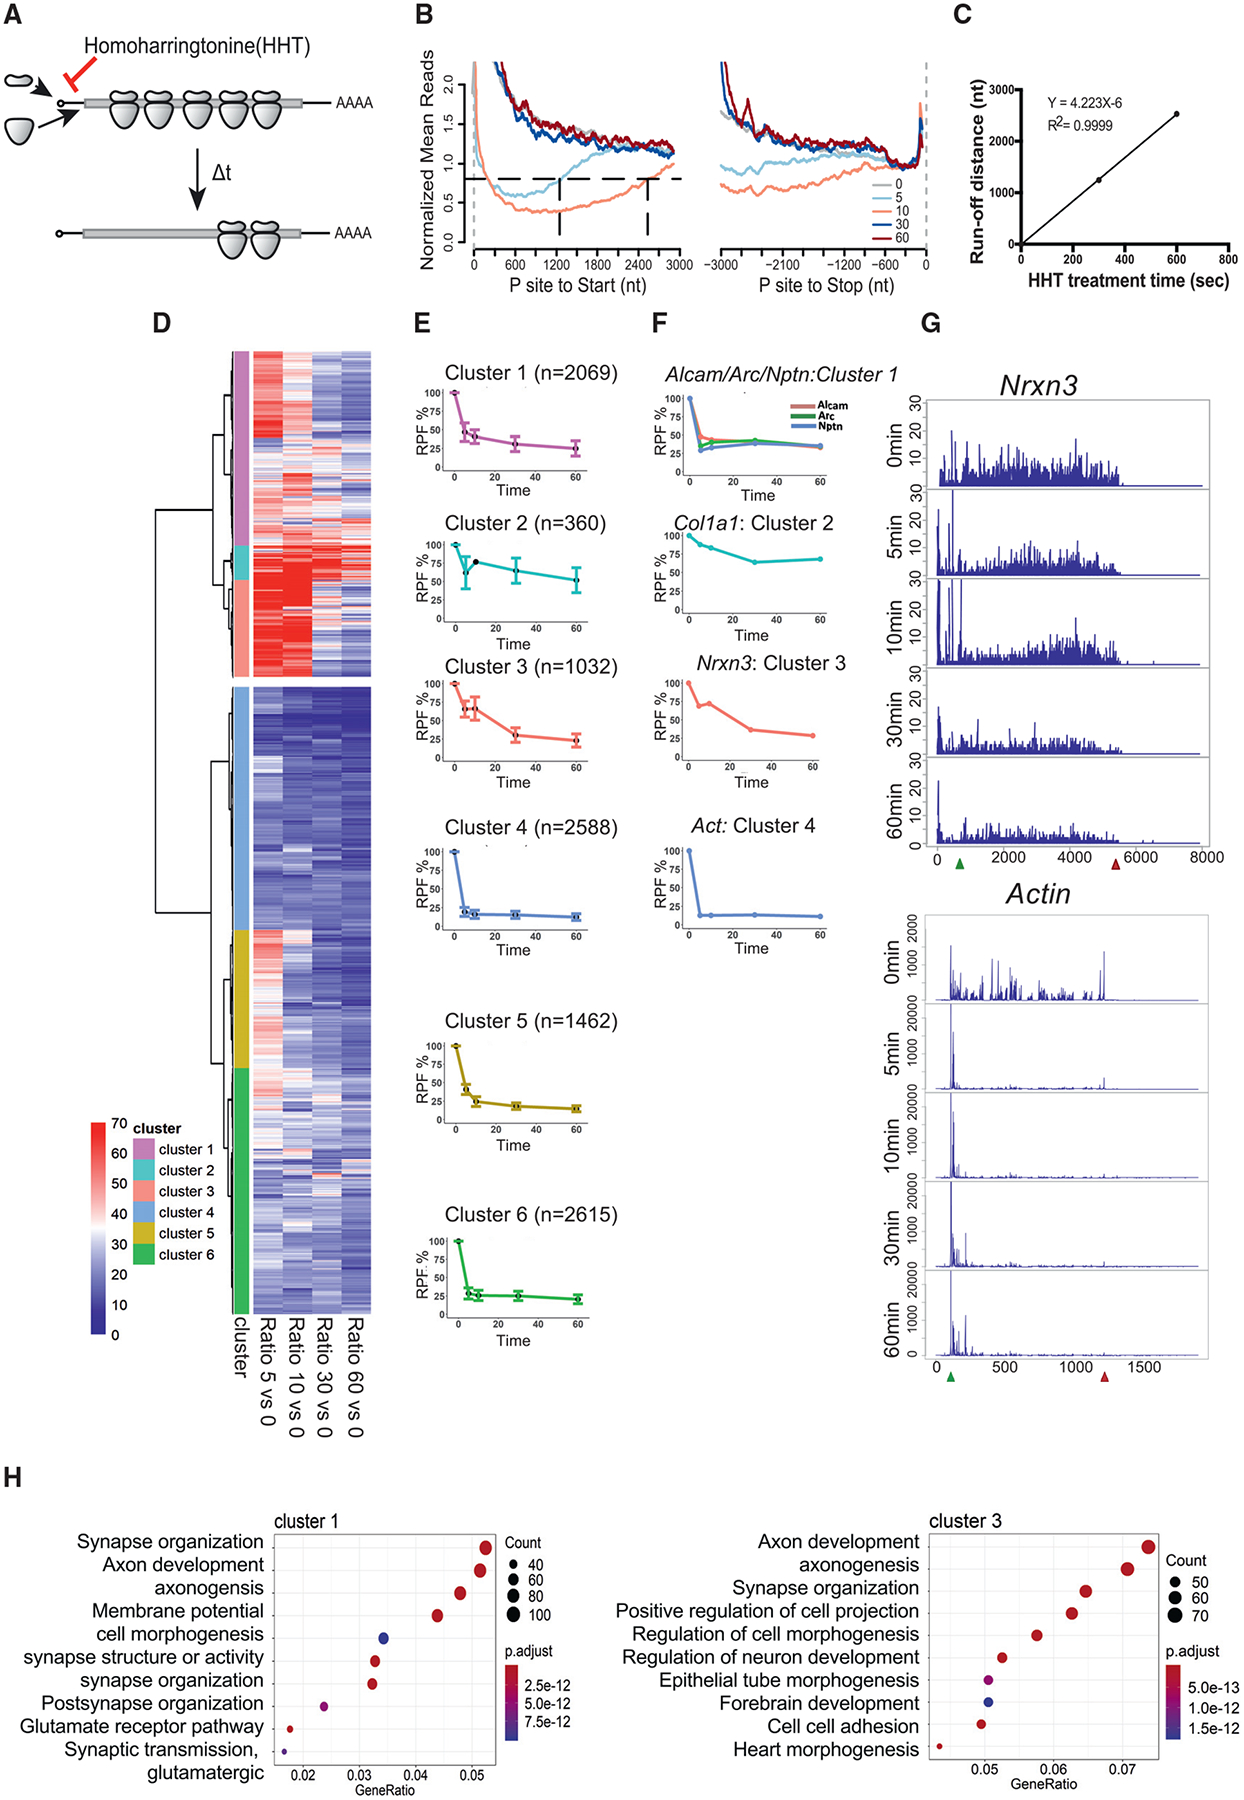
Figure 3. Runoff Ribosome Profiling of WT Mouse Brain Slices.

(A) Schematic diagram of homoharringtonine (HHT) runoff ribosome profiling. WT mouse brain slices were treated with 20 mM HHT, an inhibitor of translation initiation, to allow ribosome runoff for 5, 10, 30, and 60 min (t) at 30°C. 10 slices from two or three mice were pooled per time point of HHT treatment.
(B) Metagene plot of RPFs after HHT treatment. Reads are mapped transcripts (n = 1,401) with CDS longer than 3,000 nt and aligned at the annotated start and stop codons (gray vertical dash lines). The read densities at each nucleotide position are normalized to the average density of the last 500 nt of CDS and averaged using the P sites of RPFs. For visualization purposes, the curves were smoothed within a 90-nt window. Black horizontal dash line indicates the arbitrary 0.8 threshold to estimate the relative runoff distances (black vertical dash lines).
(C) Linear regression between the HHT treatment time and ribosome run-off distances (from B) to estimate the global elongation rate (4.2 nt/s).
(D) Cluster analysis of gene groups with distinct ribosome runoff patterns. The RPFs of each gene at each time point was normalized to time 0. The Euclidean distance matrix was then calculated, followed by hierarchical clustering using Ward’s agglomeration method (Ward, 1963).
(E) Ribosome runoff patterns for each subcluster. The global pattern of each subcluster was summarized using the corresponding median and standard deviation in each time point. The number of RNAs in each subcluster is shown in parentheses.
(F) Representative ribosome runoff profiles that reflect each subcluster. The runoff pattern for Actin is similar to subclusters 4–6.
(G) Ribosome footprints for Nrxn3 and Actin mRNAs during the runoff time period.
(H) GO terms for subclusters 1 and 3. Gene ratio refers to the percentage of total differentially expressed genes in the given GO term.
