
Figure 5. FMRP Stalls Ribosomes on Specific mRNAs.
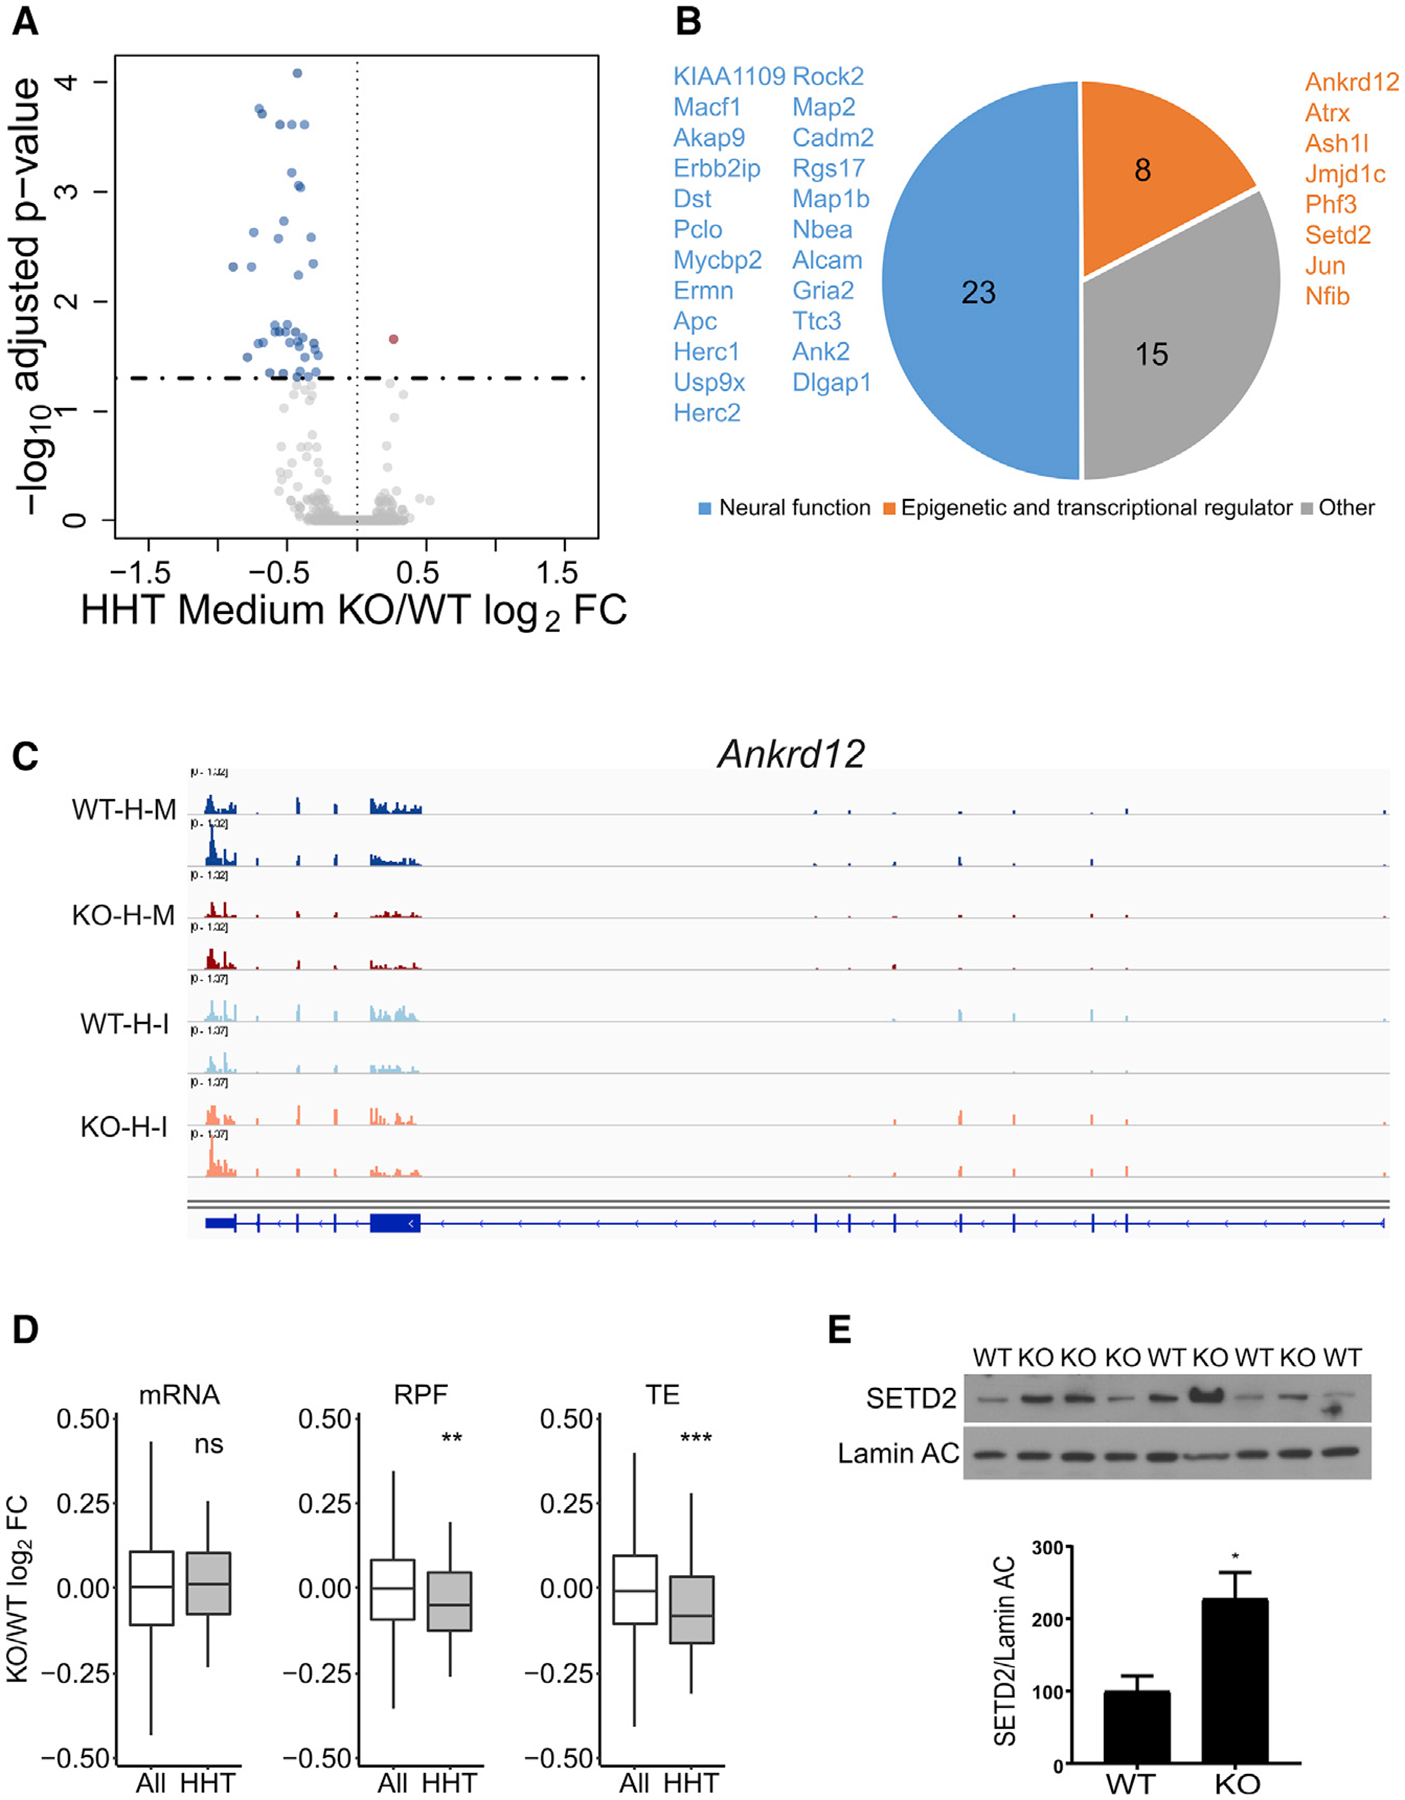
(A) RNA sedimenting to medium polysomes containing four to six ribosomes after HHT treatment of hippocampal slices; 46 RNAs are downregulated and 1 is upregulated in Fmr1 KO relative to WT.
(B) Downregulated RNAs in HHT-treated Fmr1 KO slices primarily encode epigenetic and transcriptional regulators and proteins involved in neural function.
(C) Example of Ankrd12 RNA, which has reduced reads in Fmr1 KO slices relative to WT after HHT (H) treatment. Input (I) reads are similar in both genotypes. M refers to medium fraction.
(D) Boxplot showing the fold change of Fmr1 KO versus WT of all RNAs (white) compared to those identified in (A) and (B) (gray) with respect to steady-state RNA levels, RPFs, and TE (ns, not significant; **p < 0.01; ***p < 0.001; Wilcoxon test). All grouped data are presented as mean ± s.e.m.
(E) Western blot analysis of SETD2 and lamin AC in hippocampus from four WT and five Fmr1 KO mice. When quantified and made relative to lamin AC, SETD2 was significantly increased in the KO (p = 0.0245, two-tailed t test). All grouped data are presented as mean ± s.e.m.
See also Table S1 and Figure S5E.