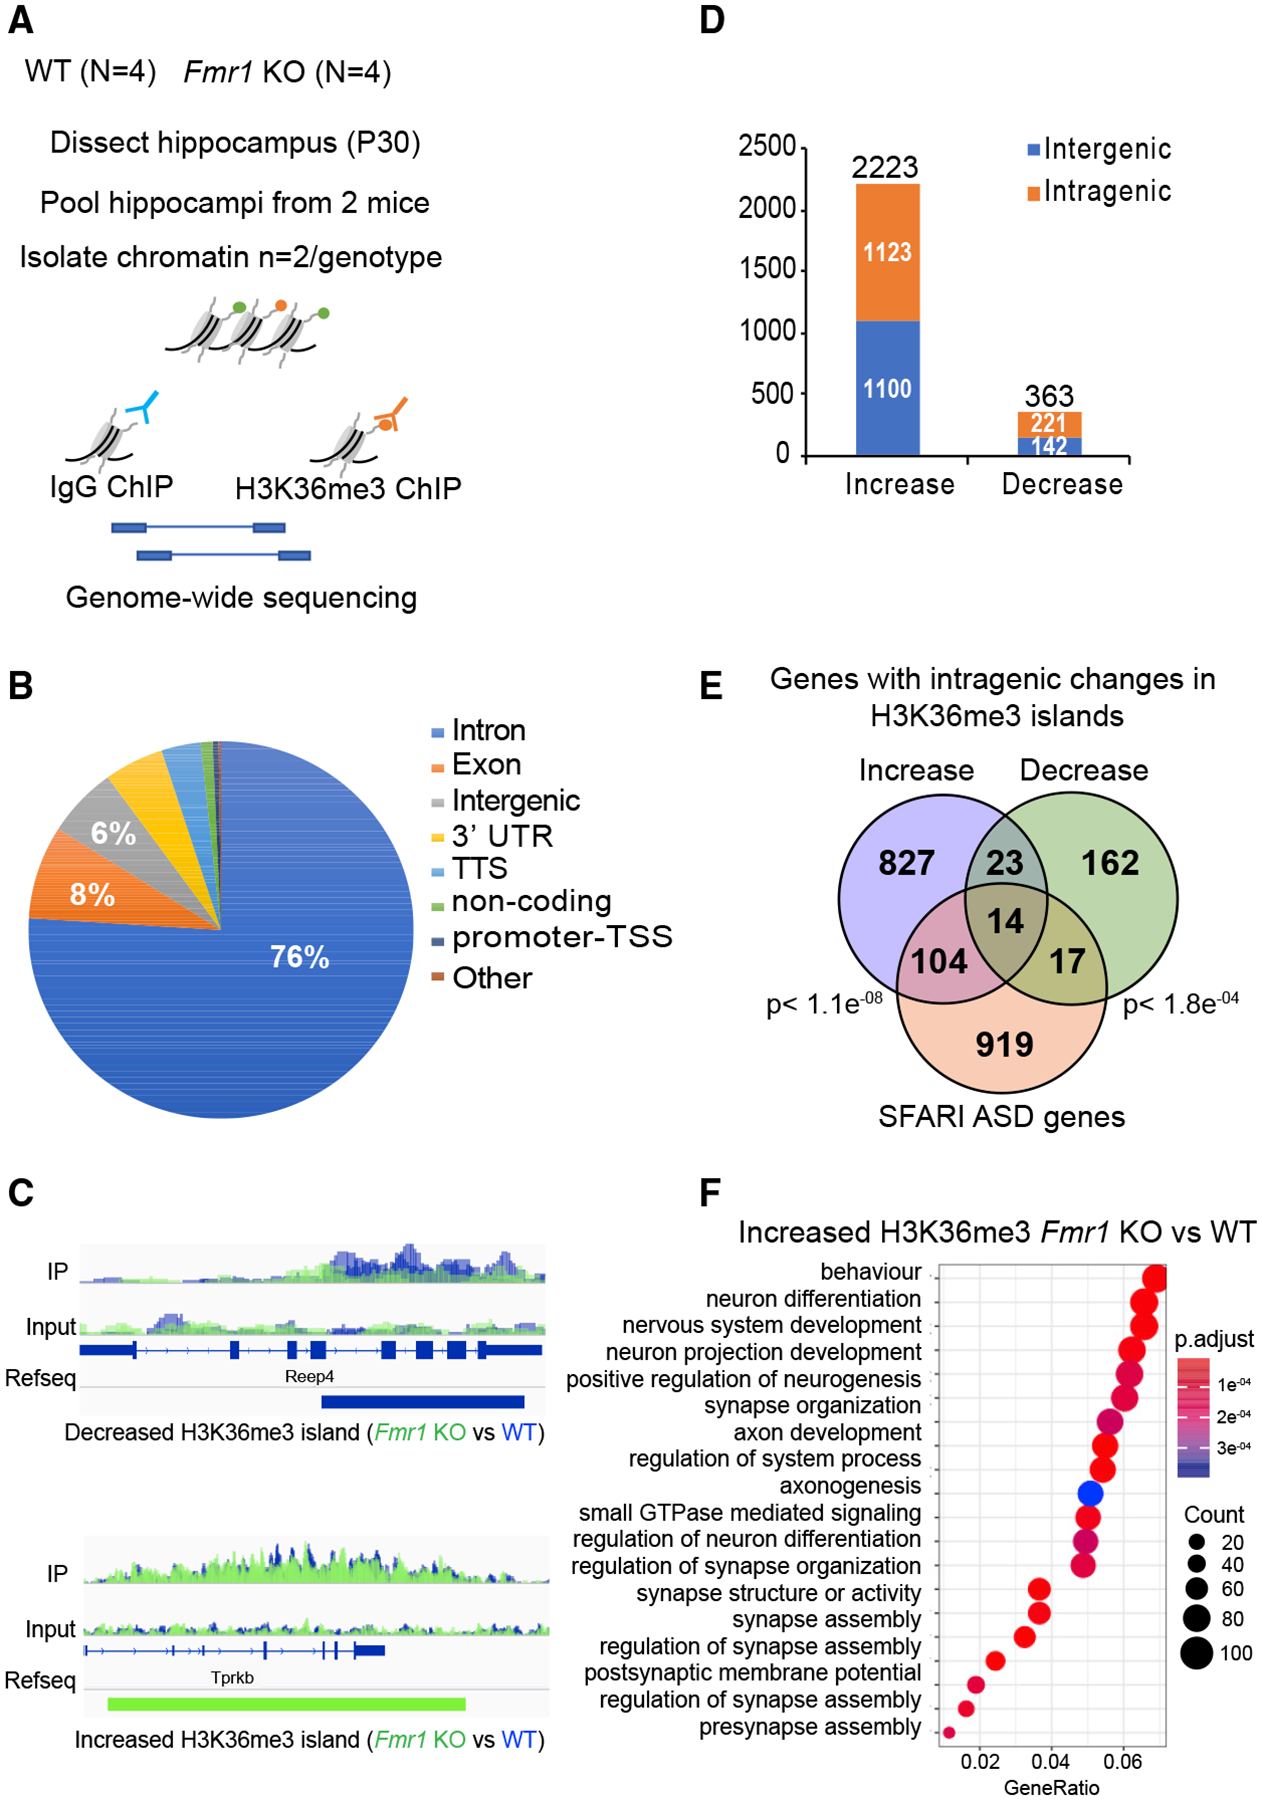
Figure 6. H3K36me3 Localization Is Altered in Fmr1 KO Hippocampus.

(A) Experimental design for in vivo ChIP-seq of H3K36me3 in hippocampus from adult WT (n = 4) and Fmr1 KO (n = 4) mice.
(B) Pie chart representing the genomic annotation of the total H3K36me3 islands identified in the WT and Fmr1 KO ChIP-seq.
(C) H3K36me3 ChIP-seq gene tracks for WT and Fmr1 KO hippocampal tissue. The two sequencing tracks from each biological replicate (n = 2 [pooled hippocampi from two mice/biological replicate]) of WT and Fmr1 KO were merged and overlaid. WT ChIP-seq tracks are in blue, and KO tracks are in green. The tracks for immunoprecipitation (IP) and input are displayed. The islands with significantly decreased (blue) or increased (green) tracks are shown below the RefSeq gene annotation (FDR < 0.0001; p < 0.01) as identified using the SICER package. Reep4 shows decreased H3K36me3 islands in Fmr1 KO, and Tprkb shows increased islands in Fmr1 KO.
(D) Distribution of significantly increased or decreased H3K36me3 islands in intragenic and intergenic regions of the genome using negative binomial test performed using edgeR (Robinson et al., 2010) (fold change >2 and p <0.05). The total number of increased or decreased islands is indicated above the respective bars in the graph in Fmr1 KO versus WT ChIP-seq.
(E) Venn diagram for significant overlap of Fmr1 KO misregulated H3K36me3 genes (increased islands in blue and decreased islands in green) with the ASD-linked genes from the SFARI database. A subset of genes showed both increased and decreased islands along the length of the gene body. The p value (hypergeometric test) is indicated next to the respective comparisons.
(F) GO term enrichment of H3K36me3 differentially enriched genes in Fmr1 KO versus WT (p adjust value < 0.05). Gene ratio refers to the percentage of total differentially expressed genes in the given GO term.
