

Abstract
Purpose:
Develop and validate an automated method for measuring liver attenuation in non-contrast low-dose chest CT (LDCT) scans and compare it to the standard manual method for identifying moderate-to-severe hepatic steatosis (HS).
Method:
The automated method identifies a region below the right lung within the liver and uses statistical sampling techniques to exclude non-liver parenchyma. The method was used to assess moderate-to-severe HS on two IRB-approved cohorts: 1) 24 patients with liver disease examined between 1/2013-1/2017 with non-contrast chest CT and abdominal MRI scans obtained within three months of liver biopsy, and 2) 319 lung screening participants with baseline LDCT performed between 8/2011-1/2017. Agreement between the manual and automated CT methods, the manual MRI method, and pathology for determining moderate-to-severe HS was assessed using Cohen’s Kappa by applying a 40 HU threshold to the CT method and 17.4% fat fraction to MRI. Agreement between the manual and automated CT methods was assessed using the intraclass correlation coefficient (ICC). Variability was assessed using Bland-Altman limits of agreement (LoA).
Results:
In the first cohort, the manual and automated CT methods had almost perfect agreement (ICC=0.97, κ=1.00) with LoA of −7.6—4.7 HU. Both manual and automated CT methods had almost perfect agreement with MRI (κ=0.90) and substantial agreement with pathology (κ=0.77). In the second cohort, the manual and automated CT methods had almost perfect agreement (ICC=0.94, κ = 0.87). LoA were −10.6—5.2 HU.
Conclusion:
Automated measurements of liver attenuation from LDCT scans can be used to identify moderate-to-severe HS on LDCT.
Keywords: hepatic steatosis, low-dose CT, image analysis, lung screening
1. INTRODUCTION
Hepatic steatosis (HS) is a common liver abnormality that occurs in about 25% of the general population [1]. HS is a component of non-alcoholic fatty liver disease (NAFLD), a spectrum of disorders that includes non-alcoholic steatohepatitis (NASH), a condition that can lead to liver cirrhosis and liver cancer. The current non-invasive reference standard for diagnosing HS is MRI [2-5], which provides a measure of liver fat content and has a high classification performance for detecting moderate-severe HS [2], defined as 17.4% fat, which equates to biopsy [6] findings of macrovesicular steatosis in 30% or more of hepatocytes. MRI is more sensitive to longitudinal changes in steatosis grade than histology [4].
Non-contrast CT also has a high sensitivity and specificity for detecting moderate-to-severe HS [7], as fat reduces CT attenuation. A threshold value of 40 HU has been widely used to identify moderate-to-severe HS on CT and non-contrast low-dose CT (LDCT) scans [8-11]. An alternate indicator of hepatic steatosis from CT scans is the liver- spleen attenuation ratio [12, 13] or the liver-spleen attenuation difference [14], which is hypothesized to be a better indicator than liver attenuation due to normalizing the liver attenuation to account for differences in scanner calibration and protocols [15]. While studies have shown using the liver-spleen attenuation ratio or attenuation difference provides better performance for detecting steatosis [9], other studies have shown that the liver attenuation alone correlates better with pathologic measurement of liver fat [8], and still other studies have found no significant difference between liver attenuation alone and liver-spleen attenuation difference [16].
Current methods for liver attenuation measurement using CT rely on radiologists to manually identify regions of interest (ROI) in each segment of the liver and measure the attenuation in each ROI [8, 10]. With the number of CT scans available for measuring liver fat and detecting HS increasing due to patients undergoing chest CT scans for lung cancer screening, an automated method capable of quickly and reproducibly measuring liver fat would be clinically relevant.
A previous automated method for measuring liver fat from screening chest CT scans was devised for a specific study and acquisition protocol where a single 5 mm slice through the liver was reconstructed from a LDCT scan [17]. The method utilized a reference liver shape probability map, distance transforms, and subject-specific thresholding to obtain an approximate segmentation of the liver. However, this method relies only on a single slice through the liver that was manually identified. There have been many other computer-based algorithms developed to automatically segment the liver [18-22] on contrast-enhanced abdominal CT scans to determine liver volume [23]. LDCT scans do not use contrast and have more image noise, particularly below the diaphragm, making it difficult to differentiate the liver from other abdominal structures.
We present a method to automatically measure liver attenuation in non-contrast chest CT as well as LDCT scans to identify moderate-to-severe HS. This algorithm does not require any manual input or changes to CT acquisition protocols. We validated the automated algorithm using two cohorts: 1) patients with histological, MRI, and CT measurements of liver fat, which allowed for comparison of liver pathology of moderate-to-severe HS assessed with both the manual and automated CT and MRI methods, and 2) participants in a LDCT lung cancer screening program [10] with manual and automated CT measurements of liver attenuation.
2. MATERIALS AND METHODS
2.1. Automated liver CT attenuation measurement
We developed an automated method to measure the liver attenuation from LDCT scans of the chest. We made two assumptions: 1) the region below the right lung contains the liver, and 2) the liver parenchyma is homogenous. These assumptions allowed us to use the right diaphragm as a landmark to locate a region that includes the liver and to reject sub-regions that do not contain liver parenchyma.
The automated algorithm is comprised of the following two steps: 1) lung diaphragm identification, 2) liver region generation and statistical region analysis.
Step 1: Right lung diaphragm identification
In order to identify the right lung diaphragm, we first segmented the left and right lungs from the CT scan using a previously published algorithm [24] that uses a combination of thresholding, morphological filtering, and region growing. The results of this segmentation step are binary images of the left and right lungs separately. We only used the right lung segmentation image in the following steps.
As the liver is underneath the right lung, the diaphragm region from the right lung segmentation is identified and projected downwards into the liver to generate the liver ROI. The diaphragm has a domed shape, which has its largest circumference at the base of the lungs (Figure 1). To robustly identify the apex of the diaphragm (point A in Figures 1 and 2), we utilized the corresponding change in the cross-sectional area of the lung. A plot of the cross-sectional lung area on each CT image slice is shown in Figure 3. At its base, the lung has the smallest area (point B). The area increases rapidly from the base to the top of the diaphragm, then increases more slowly until the widest point of the lung is reached. Moving higher in the lung, the cross-sectional area decreases as the lung apices are approached. The apex of the diaphragm is determined by identifying the CT image slice where the slope of the cross-sectional area begins to decrease (point A, Figure 2).
Figure 1.

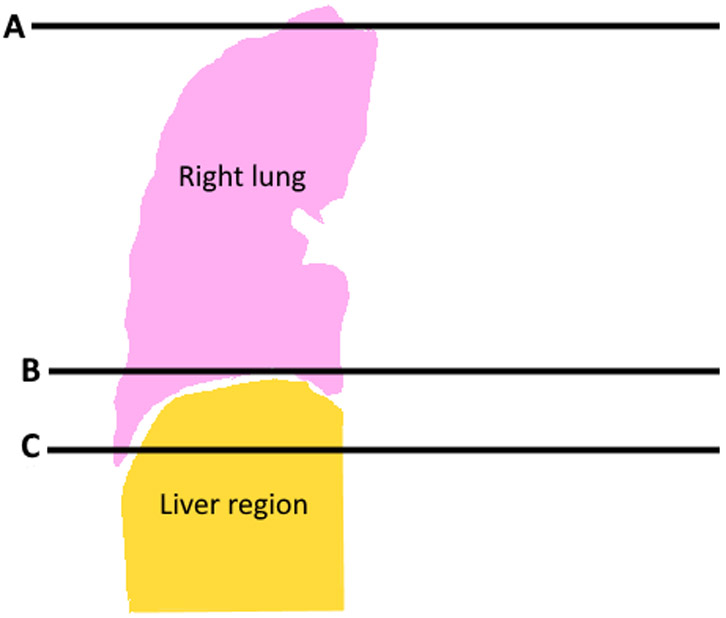
A coronal image of a) a chest LDCT scan using mediastinal windows, and b) a diagram of the LDCT image showing the right lung segmentation (pink) and the region containing the liver (tan). Line A indicates the axial CT slice that contains the highest point of the right hemi-diaphragm and line B indicates an area near the bottom of the right lung; these are referenced in subsequent figures.
Figure 2.


Plot of cross-sectional area of the right lung for each slice of a non-contrast chest CT scan. The CT slice at the top of the scan has a lower slice number than the CT slice at the bottom on the scan. Selected axial slices of the CT scan are labeled on the plot, with the corresponding images below the plot. Starting from the bottom of the lung (right side of the plot, indicated as point B), the cross sectional area of the lung slowly increases, then increases rapidly before reaching a peak (point A) and decreasing again. The top of the diaphragm for the right lung is located on slice 315 with an area of 188.6 cm2, indicated as A. Point B (area=3.4 cm2) represents a slice near the bottom of the lung and is included to provide a visual reference.
Figure 3.


Liver region of interest identified on chest CT. A 3D reconstructed image in the coronal plane (A) and sagittal plane (B) and axial non-contrast CT images at two different levels (C and D) show the lung (pink) and right liver region (tan).
Step 2: Liver region generation and statistical region analysis
We define the liver region as the volume below the right lung (Figure 1), starting from the apex of the diaphragm and extending 70 mm downward. To ensure that we only include the liver, we excluded the segmented lung from step 1 and the heart [25] (Figure 3).
To ensure that only liver parenchyma was included in the liver region of interest, we divided the liver region into non-overlapping 1.0 cm3 cubic sub-regions. For each of these cubic sub-regions, the mean attenuation (in HU) of all the pixels in the sub-region was computed. The interquartile range (IQR) of all the cubic sub-region means was calculated (Figure 4a), and only those sub-regions with a mean attenuation within the IQR were included (Figure 4b). The mean liver attenuation is reported as the mean of the included cubic sub-region attenuations.
Figure 4.


Histogram of mean intensity of the 1 cm3 cubes of the liver region of interest a) with all cubes and b) after keeping only the cubic sub-regions within the first and third quartiles (inner quartile range (IQR). Blue line indicates the median, black dashed lines indicate the limits of the IQR.
2.2. Manual liver attenuation measurement
2.2.1. MRI fat and CT attenuation measurement
For participants with MRI and CT images available, the radiologist (SL, 8 years experience), blinded to histopathology, and manually co-registering the liver ROIs on CT and MR images, selected a ROI, at least 1.0 cm3 diameter, in each of the four sectors of the liver in a single CT slice, as defined by Couinaud [26], and measured the attenuation (HU) for each ROI on CT and fat fraction (FF) on MRI, selectively avoiding cysts, lesions, large blood vessels and artifacts.
2.2.2. CT attenuation measurement
For participants with only CT images available, the same approach as described in the previous section was performed by radiologists (XC, 8 years of experience, TM,13 years of experience).
2.3. Participants
We validated the algorithm on two separate cohorts. Waiver of informed consent was obtained for the liver disease cohort, and informed consent was obtained for the lung screening cohort. Our institutional review board approved all investigations, which were HIPAA compliant.
The first cohort was comprised of patients with liver disease where chest CT, abdominal MRI, and liver histopathology evaluation of liver fat could be done, allowing the three techniques to be compared. These 24 patients were obtained by searching our pathology database between 12/2013–1/2017 using the term “hepatocellular carcinoma, HCC” or “intrahepatic cholangiocarcinoma, ICC” [27] which identified 24 patients with 1) histopathology, 2) non-contrast chest CT within 1 month of liver MRI, and 3) both non-contrast chest CT and liver MRI within 3 months of the liver biopsy. Patients with technically inadequate CT or MRI scans, large visible tumors (greater than 1 cm) or ascites, and who received treatment for liver cancer prior to imaging were excluded. The median patient age was 65 years old (IQR 54–69 years), with 8 females and 16 males. Experienced liver pathologists graded HS as none, mild, moderate, and severe according to standard clinical protocols using liver tissue from surgical resection in 21 patients; three patients with needle biopsies did not have graded HS [28-30].
On this set of patients, a single radiologist manually measured the liver attenuation on CT and the FF from MRI; the automated algorithm was used to measure the liver attenuation on CT. The manual and automated CT measurements were compared with each other, and the classification of moderate-to-severe HS for the automated method was compared with manually made CT and MRI measurement and the histopathology evaluation of liver fat.
The second cohort was comprised of 319 asymptomatic participants in a LDCT screening program for lung cancer who had a baseline LDCT between 2/2011 and 1/2017, aged 40 and older (median age 61 years, IQR 57–66 years) [10]. There were 206 male and 113 female participants. Manual measurements were available for this cohort and the automated algorithm was compared to manual CT measurement of liver attenuation.
2.4. Imaging acquisition
2.4.1. Liver disease cohort
Non-contrast chest CTs were obtained in the supine position in a single breath-hold on several CT platforms (Lightspeed Ultra, Lightspeed VCT, Discovery CT750HD, and Revolution, GE Healthcare; Somatom Definition Flash, Somatom Definition AS, Sensation Cardiac 64, and Force, Siemens Healthineers) using clinical acquisition protocols: 100 or 120 kVp, 106–663 mA, 0.600 mm (Siemens), 0.625 or 1.25 mm (GE) collimation, slice thickness 1.00–3.00 mm, and reconstruction kernels of B40f for Somatom Definition AS and Sensation Cardiac 64, I31f for Somatom Definition Flash, and standard for all GE scanners. Liver attenuation on CT was measured in HU on mediastinal window settings (width 350 HU; level 25 HU).
Multichannel MRI systems were used for all patients (1.5T: Avanto, Aera, and Sonata, Siemens Healthineers; and Signa HD and Optima 450w, GE Medical Systems or 3T: Skyra and Biograph mMR, Siemens Healthineers; and Discovery 750, GE Medical Systems) [27]. The liver MRI sequences and acquisition parameters followed clinical protocols. T1WI in- and out-of-phase imaging was performed in all cases and used to calculate the fat fraction percentage (FF).
2.4.2. Lung screening cohort
Non-contrast LDCT was obtained in the supine position in a single breath on Somatom Definition Flash CT or Somatom Force (Siemens Healthineers), or Revolution CT, LightSpeed VCT, or Discovery CT750 HD (GE Medical Systems) CT scanners. Acquisition parameters were: 120 kVp, 29–590 mA with dose modulation, 0.60 mm (Siemens) or 0.625 mm (GE) collimation width, 0.5 mm (Siemens) or 0.625 mm (GE) slice thickness, and reconstruction kernels of either I41f or Br40d for Siemens, and standard for GE. Dose modulation was used for all scans which were low-dose.
2.5. Statistical analysis
Mean and standard deviation of the liver CT and MRI ROIs were calculated. Continuous CT and MRI measurements were dichotomized using established thresholds for moderate-to-severe HS: 40 HU on CT [31] and 17.4% FF on MRI [3]. Agreement between manual and automated methods for classifying moderate-to-severe-HS was assessed using Cohen’s kappa coefficient. Bland-Altman analysis was also used to assess agreement [32]. Linear regression analysis was performed to assess the relationship between the liver attenuation measured by automated and manual methods and to calculate the intraclass correlation coefficient (ICC). The scale used for the kappa and ICC extent of agreement was: 0.01–0.20 slight, 0.21–0.40 fair, 0.41–0.60 moderate, 0.61–0.80 substantial, and 0.81–0.99 almost perfect [33]. All calculations and analyses used R and SAS [34].
3. RESULTS
The total runtime of the automated method on both cohorts was 10735.9 seconds, resulting in an average of 31.3 seconds (10735.9/343) for the entire LDCT scan (Intel Xeon E5–2670 v3). The average number of sampled cubes per case was 456, ranging from 132 to 841. The average number of sampled cubes within the IQR, was 228, ranging from 66 to 420.
3.1. Liver disease cohort
Of the 24 liver disease patients, 15 were men and nine were women, with an average age of 60.3 (SD 12.6 y). MRI liver FF ranged from 0.0% to 28.8% (mean of 8.8%). Manual CT liver attenuation ranged from 20.5 to 67.5 HU (mean of 46.0 HU, SD of 13.3 HU) and automated liver attenuation ranged from 19.3 to 64.9 HU (mean of 44.5 HU, SD of 12.3 HU). Average manual and automated CT liver attenuation values differed by 1.5 HU (46.0 and 44.5 HU, p =0.698) and were not significantly different. Bland-Altman limits of agreement (LoA) for the manual and automated measurements were −7.6 to 4.7 HU (Figure 6a).
Figure 6.


Bland-Altman plots comparing the automated and manual CT methods for the a) liver disease cohort and b) the lung screening cohort.
The manual and automated CT methods were in perfect agreement with each other (κ=1.00, ICC=0.97, 95% CI: 0.92 – 0.99), and were in almost-perfect agreement with the MRI method (κ=0.90 for both, 95% CI: 0.69 – 1.00). The manual and automated CT methods had substantial agreement with pathology (κ=0.77 for both, 95% CI: 0.47 – 1.00). For the 21 patients with pathology-graded HS, MRI and pathology were in almost-perfect agreement with each other (κ=0.88, 95% CI: 0.64 – 1.00). Figure 5a shows the box plots for the MRI, manual and automated CT measurements for each patient. For each patient, the individual box plot provides the 25% and 75% quartile values. Clearly, the manual CT method had greater intra-patient variability than the automated method. The MRI-based FF measurements cannot be directly compared to the CT-based HU values on the same y-axis and thus the CT HU axis is shown on the left and the MRI FF axis on the right.
Figure 5.


Comparison of the variation of the automated and manual CT methods. a) Box plot (showing the range, median and 1st and 3rd quartiles) for automated (blue) and manual CT (red) methods and MRI (black) method on the 24 patients in the liver disease cohort. B) Standard deviation for each of the 319 participants in the lung screening cohort, separately for the automated CT (blue) and manual CT (red) methods. The automated method had a smaller standard deviation than the manual method. A line is drawn at 5.0 Hounsfield Units (HU) standard deviation; all of the measurements by the automated method had a standard deviation below 5.0 HU, while 80/319 participants had a standard deviation above 5.0 HU for the manual method.
Table 1 provides the pathology, MRI, manual and automated CT results for the 24 patients. Classification by both manual and automated CT HU attenuation values agreed with the MRI classification for 23 of 24 patients, with 85.7% sensitivity (6/7), 94.4% specificity (17/18), 85.7% PPV (6/7), and 100% NPV (17/17). One patient, #18, had automated and manually-determined CT attenuation values of 33.4 HU and 31.2 HU, respectively, both below the 40 HU threshold for moderate-to-severe HS. Pathology showed mild HS and the FF on MRI was 9.0%, indicating mild HS; thus, pathology and MRI categorized the patient as having mild HS, while CT categorized the patient as having moderate HS.
Table 1.
Pathology, manual and automated CT, and MRI results for the liver disease cohort of 24 patients sorted by MRI fat fraction. Steatosis was not scored by histopathology in three patients.
| Patient | Steatohepatitis grade | MRI % (avg) | Manual CT (HU) (avg) |
Automated CT (HU) (avg) |
|---|---|---|---|---|
| 1 | . | 0.00 | 51.75 | 50.81 |
| 2 | None | 0.00 | 64.50 | 64.93 |
| 3 | None | 0.00 | 60.50 | 59.74 |
| 4 | None | 0.00 | 55.25 | 54.74 |
| 5 | None | 0.00 | 54.75 | 50.22 |
| 6 | None | 0.00 | 67.50 | 62.34 |
| 7 | None | 0.00 | 54.67 | 42.27 |
| 8 | Mild | 0.00 | 44.25 | 42.70 |
| 9 | None | 2.00 | 50.00 | 48.90 |
| 10 | None | 2.33 | 58.67 | 54.62 |
| 11 | . | 3.25 | 50.50 | 51.73 |
| 12 | None | 4.00 | 47.00 | 46.51 |
| 13 | None | 6.75 | 53.75 | 48.72 |
| 14 | Mild | 6.75 | 47.75 | 48.07 |
| 15 | None | 7.50 | 51.25 | 49.58 |
| 16 | None | 7.75 | 47.25 | 47.81 |
| 17 | . | 8.25 | 50.50 | 50.01 |
| 18 | Mild | 9.00 | 31.25 | 33.37 |
| 19 | Mild | 18.75 | 32.25 | 29.33 |
| 20 | Moderate | 22.25 | 26.75 | 28.89 |
| 21 | Moderate | 26.50 | 23.75 | 24.77 |
| 22 | Severe | 27.00 | 33.75 | 32.38 |
| 23 | Moderate | 28.75 | 26.00 | 27.24 |
| 24 | Severe | 28.75 | 20.50 | 19.26 |
The three patients who underwent needle biopsy did not have known steatosis pathology grades and for the remaining 21 patients, pathology HS grade was none or mild in 16 patients and moderate-to-severe in five. MRI FF agreed with pathology in all but patient #19, who was classified as having mild HS by histopathology and moderate-to-severe HS by MRI FF and CT.
3.2. Lung screening cohort
Agreement was almost perfect between the manual and automated CT methods (ICC=0.90, 95% CI: 0.88 – 0.92). CT liver attenuation ranged from 17.6 to 71.8 HU (mean of 55.1 HU, SD of 10.7 HU) for the manual method and from 12.9 to 72.2 HU (mean of 52.4 HU, SD of 11.3 HU) for the automated method. The mean of the manual and automated CT methods, although significantly different (p<0.001), only differed by 2.7 HU. Bland-Altman LoA were −10.6 to 5.2 HU (Figure 6b).
Due to the number of participants, box plots, used in 5a, were not a feasible visualization method; instead, for each participant, we plotted the standard deviation of the manual and automated methods. For the manual method, the standard deviation is across the four ROIs, while for the automated method, the standard deviation is across all the cube samples. As shown in Figure 5b, the automated CT method had less intra-patient variability than the manual method: None of the automated SDs differed by more than 5.0 HU while 80 of the manual SDs differed by more than 5.0 HU.
Agreement was substantial between the manual and automated CT methods in identifying participants with moderate-to-severe HS (κ = 0.87, 95% CI: 0.79-0.95). The manual method identified 36 participants below the 40 HU threshold while the automated method identified 43. There was agreement for 275/283 as being above 40 HU and for 35/36 participants being below 40 HU. Disagreement occurred for nine (2.8%) of the 319 participants. This results in a sensitivity of 97.2% (35/36), and specificity of 97.2% (275/283). The positive predictive value (PPV) is 81.4% (35/43) and the negative predictive value (NPV) is 99.6% (275/276). Of the nine cases, six had an automated CT measurement within 10 HU of the manual measurement. The largest difference (automated 30.2 HU-manual 44.9 HU= 14.7 HU) was in a patient whose liver extended beyond the midline into the region below the left lung, and whose liver attenuation differed between the right and left segments. Notably, for this case, the left segments, which were not included in the liver ROI of the automated method, had a higher density than the right segments as measured by the radiologist.
Figure 7 provides the linear regression analysis of the manual and automated CT methods for each of the 319 participants. Using a forced zero intercept, the regression equation was: automated measurement = 0.95 * manual measurement. The agreement was excellent (R2 = 0.99).
Figure 7.

Scatter plot of automated vs. manual liver attenuation values on LDCT and the best linear regression line (automated attenuation = 0.95*manual attenuation, R2=0.99). Lines are drawn at 40 HU showing the accepted manual threshold for moderate-to-severe HS.
4. DISCUSSION
We created an automated method to measure liver attenuation on non-contrast CT scans that targets chest LDCTs where the scans do not contain the entire liver and have high levels of noise, making liver segmentation difficult. Our automated method had almost perfect agreement with the manual method performed by experienced radiologists and, importantly, the automated method had a far smaller SD and IQR for each case than the manual method.
A key question in evaluating new quantitative imaging methods is what to use as ground truth or “reference standard.” For many years, histopathology was considered the reference for diagnosing HS; however, there is poor agreement among pathologists and poor reproducibility in assessing HS grade [35]. MRI FF is the current reference standard and is more sensitive in detecting changes in the liver fat compared to the histology-determined steatosis grade [4] while avoiding bleeding and other risks of liver biopsy. CT is less sensitive than MRI for diagnosing mild HS but can reliably identify moderate-to-severe HS. Manually-determined CT ROI-based measurements have high variability [36], as also shown by our results (Figure 5). As suggested by experts for evaluation of imaging biomarkers [37], we assessed the variability of each method and compared it to the histopathology steatosis grade.
The liver disease cohort allowed histopathology, MRI, and CT data to be compared to each other. For these 24 patients, the manual and automated CT methods had identical classification results: Seven of 24 were classified with moderate-to-severe HS. Of the 21 patients with histopathology data, five were graded moderate-to-severe HS. MRI classified six of the 24 patients as moderate-to-severe HS. There was almost perfect agreement between the manual and automated CT methods (κ=1.00), between both CT methods and the MRI method (κ=0.90 for both), and there was substantial agreement between both CT methods and pathology (κ=0.77 for both) and between MRI and pathology (κ=0.88). This demonstrates that the automated method performs similarly to three established methods.
The automated algorithm attenuation values were slightly lower, 2.7 HU, than the manual method. This difference is unlikely to be clinically significant. The manual method uses four ROIs selected by a radiologist in a single CT slice while the automated method uses many 1 cm cubes from the liver ROI that are located below the right lung, which may explain the difference; previous work comparing manual volumetric to single-slice ROI-based methods for measuring liver tumor attenuation showed a greater average difference (7.4 HU) than the 2.7 HU observed in this study [36].
We assessed the intra-patient variability of each method using the standard deviation of the ROIs for the manual method and the sampled cubes for the automated method. The automated method has a smaller standard deviation compared to the manual method, indicating better repeatability (Figure 5b).
A novel feature of our algorithm is not relying on explicitly segmenting the liver to identify the liver parenchyma. Rather, it selects regions representing the liver parenchyma by applying statistical sampling methods to a volume that is expected to include the liver based on anatomical reference points. Many investigators who developed algorithms for liver segmentation from contrast-enhanced CT noted the difficulty of designing algorithms for low-contrast images where the liver density is similar to adjacent organs [19, 22, 23]. Our algorithm used statistical techniques to remove outliers, thus avoiding many of the issues faced by segmentation algorithms. A non-segmentation method has been previously used to measure pulmonary nodule growth and obtained reproducible results even for complex nodules [38].
One of the key assumptions of the algorithm is that the liver is a fairly homogenous organ. This same assumption is used to justify manual measurements of liver attenuation of four ROIs in a single CT slice. However, HS may not be uniformly present in the liver and may result in differing detection performance for steatosis based on the liver segment [39]. Inaccuracies may also occur if large tumors or other abnormalities adjacent to the liver (e.g. ascitic fluid) are inappropriately included in the measurement of the liver parenchyma. In many cases, it is possible to determine if non-parenchymal tissue is included because the attenuation values will have a bimodal distribution, which the algorithm can automatically flag for review.
We recognize several limitations to our study. We did not have histopathologic data for patients in the lung cancer screening cohort. The study of 319 screening participants was performed at a single institution using a limited number of scanning protocols. While this decreases variability, it limits generalizability, as differences in measurements from CT scans may be due to scanner manufacturer, dose, and protocols [40]. The algorithm also only looks at the region under the right lung; parts of the liver extending beyond this region will not be included in the analysis. Finally, our algorithm only measures the liver attenuation and not the liver to spleen attenuation ratio, another often used measure [12].
In conclusion, we developed an algorithm for automated determination of liver attenuation on LDCT. This automated method had excellent agreement with the manual method and MRI-based diagnosis of moderate-to-severe HS. By assessing liver attenuation on LDCT performed on participants in lung cancer screening programs, moderate-to-severe HS can be identified in asymptomatic participants without any additional imaging or radiation exposure.
Abbreviations:
- (LDCT)
low-dose CT
- (HS)
hepatic steatosis
- (ICC)
intraclass correlation coefficient
- (LoA)
Limits of Agreement
- (NAFLD)
non-alcoholic fatty liver disease
- (NASH)
non-alcoholic steatosis
- (ROI)
region of interest
- (IQR)
inter-quartile range
- (FF)
fat-fraction
- (SD)
standard deviation
- (CI)
confidence interval
- (PPV)
positive predictive value
- (NPV)
negative predictive value
REFERENCES
- [1].Bedogni G, Miglioli L, Masutti F, Tiribelli C, Marchesini G, Bellentani S, Prevalence of and risk factors for nonalcoholic fatty liver disease: the Dionysos nutrition and liver study, Hepatology 42(1) (2005) 44–52. [DOI] [PubMed] [Google Scholar]
- [2].Tang A, Tan J, Sun M, Hamilton G, Bydder M, Wolfson T, Gamst AC, Middleton M, Brunt EM, Loomba R, Lavine JE, Schwimmer JB, Sirlin CB, Nonalcoholic fatty liver disease: MR imaging of liver proton density fat fraction to assess hepatic steatosis, Radiology 267(2) (2013) 422–31. [DOI] [PMC free article] [PubMed] [Google Scholar]
- [3].Tang A, Desai A, Hamilton G, Wolfson T, Gamst A, Lam J, Clark L, Hooker J, Chavez T, Ang BD, Middleton MS, Peterson M, Loomba R, Sirlin CB, Accuracy of MR imaging-estimated proton density fat fraction for classification of dichotomized histologic steatosis grades in nonalcoholic fatty liver disease, Radiology 274(2) (2015) 416–25. [DOI] [PMC free article] [PubMed] [Google Scholar]
- [4].Noureddin M, Lam J, Peterson MR, Middleton M, Hamilton G, Le TA, Bettencourt R, Changchien C, Brenner DA, Sirlin C, Loomba R, Utility of magnetic resonance imaging versus histology for quantifying changes in liver fat in nonalcoholic fatty liver disease trials, Hepatology 58(6) (2013) 1930–40. [DOI] [PMC free article] [PubMed] [Google Scholar]
- [5].Bohte AE, van Werven JR, Bipat S, Stoker J, The diagnostic accuracy of US, CT, MRI and 1H-MRS for the evaluation of hepatic steatosis compared with liver biopsy: a meta-analysis, European radiology 21(1) (2011) 87–97. [DOI] [PMC free article] [PubMed] [Google Scholar]
- [6].Angulo P, Nonalcoholic fatty liver disease, The New England journal of medicine 346(16) (2002) 1221–31. [DOI] [PubMed] [Google Scholar]
- [7].Park SH, Kim PN, Kim KW, Lee SW, Yoon SE, Park SW, Ha HK, Lee MG, Hwang S, Lee SG, Yu ES, Cho EY, Macrovesicular hepatic steatosis in living liver donors: use of CT for quantitative and qualitative assessment, Radiology 239(1) (2006) 105–12. [DOI] [PubMed] [Google Scholar]
- [8].Kodama Y, Ng CS, Wu TT, Ayers GD, Curley SA, Abdalla EK, Vauthey JN, Charnsangavej C, Comparison of CT methods for determining the fat content of the liver, AJR. American journal of roentgenology 188(5) (2007) 1307–12. [DOI] [PubMed] [Google Scholar]
- [9].Rogier J, Roullet S, Cornelis F, Biais M, Quinart A, Revel P, Bioulac-Sage P, Le Bail B, Noninvasive assessment of macrovesicular liver steatosis in cadaveric donors based on computed tomography liver-to-spleen attenuation ratio, Liver Transpl 21(5) (2015) 690–5. [DOI] [PubMed] [Google Scholar]
- [10].Chen X, Li K, Yip R, Perumalswami P, Branch AD, Lewis S, Del Bello D, Becker BJ, Yankelevitz DF, Henschke CI, Hepatic steatosis in participants in a program of low-dose CT screening for lung cancer, European journal of radiology 94 (2017) 174–179. [DOI] [PubMed] [Google Scholar]
- [11].Davidson LE, Kuk JL, Church TS, Ross R, Protocol for measurement of liver fat by computed tomography, Journal of applied physiology 100(3) (2006) 864–8. [DOI] [PubMed] [Google Scholar]
- [12].Zeb I, Li D, Nasir K, Katz R, Larijani VN, Budoff MJ, Computed tomography scans in the evaluation of fatty liver disease in a population based study: the multi-ethnic study of atherosclerosis, Academic radiology 19(7) (2012) 811–8. [DOI] [PMC free article] [PubMed] [Google Scholar]
- [13].Piekarski J, Goldberg HI, Royal SA, Axel L, Moss AA, Difference between liver and spleen CT numbers in the normal adult: its usefulness in predicting the presence of diffuse liver disease, Radiology 137(3) (1980) 727–9. [DOI] [PubMed] [Google Scholar]
- [14].Park YS, Park SH, Lee SS, Kim DY, Shin YM, Lee W, Lee SG, Yu ES, Biopsy-proven nonsteatotic liver in adults: estimation of reference range for difference in attenuation between the liver and the spleen at nonenhanced CT, Radiology 258(3) (2011) 760–6. [DOI] [PubMed] [Google Scholar]
- [15].Zhang YN, Fowler KJ, Hamilton G, Cui JY, Sy EZ, Balanay M, Hooker JC, Szeverenyi N, Sirlin CB, Liver fat imaging-a clinical overview of ultrasound, CT, and MR imaging, The British journal of radiology 91(1089) (2018) 20170959. [DOI] [PMC free article] [PubMed] [Google Scholar]
- [16].Pickhardt PJ, Park SH, Hahn L, Lee SG, Bae KT, Yu ES, Specificity of unenhanced CT for non-invasive diagnosis of hepatic steatosis: implications for the investigation of the natural history of incidental steatosis, European radiology 22(5) (2012) 1075–82. [DOI] [PubMed] [Google Scholar]
- [17].Kullberg J, Hedstrom A, Brandberg J, Strand R, Johansson L, Bergstrom G, Ahlstrom H, Automated analysis of liver fat, muscle and adipose tissue distribution from CT suitable for large-scale studies, Sci Rep 7(1) (2017) 10425. [DOI] [PMC free article] [PubMed] [Google Scholar]
- [18].Linguraru MG, Sandberg JK, Li Z, Shah F, Summers RM, Automated segmentation and quantification of liver and spleen from CT images using normalized probabilistic atlases and enhancement estimation, Medical physics 37(2) (2010) 771–83. [DOI] [PMC free article] [PubMed] [Google Scholar]
- [19].Suzuki K, Kohlbrenner R, Epstein ML, Obajuluwa AM, Xu J, Hori M, Computer-aided measurement of liver volumes in CT by means of geodesic active contour segmentation coupled with level-set algorithms, Medical physics 37(5) (2010) 2159–66. [DOI] [PMC free article] [PubMed] [Google Scholar]
- [20].Linguraru MG, Richbourg WJ, Liu J, Watt JM, Pamulapati V, Wang S, Summers RM, Tumor burden analysis on computed tomography by automated liver and tumor segmentation, IEEE transactions on medical imaging 31(10) (2012) 1965–76. [DOI] [PMC free article] [PubMed] [Google Scholar]
- [21].Gao L, Heath DG, Kuszyk BS, Fishman EK, Automatic liver segmentation technique for three-dimensional visualization of CT data, Radiology 201(2) (1996) 359–64. [DOI] [PubMed] [Google Scholar]
- [22].Campadelli P, Casiraghi E, Esposito A, Liver segmentation from computed tomography scans: a survey and a new algorithm, Artificial intelligence in medicine 45(2–3) (2009) 185–96. [DOI] [PubMed] [Google Scholar]
- [23].Heimann T, van Ginneken B, Styner MA, Arzhaeva Y, Aurich V, Bauer C, Beck A, Becker C, Beichel R, Bekes G, Bello F, Binnig G, Bischof H, Bornik A, Cashman PM, Chi Y, Cordova A, Dawant BM, Fidrich M, Furst JD, Furukawa D, Grenacher L, Hornegger J, Kainmuller D, Kitney RI, Kobatake H, Lamecker H, Lange T, Lee J, Lennon B, Li R, Li S, Meinzer HP, Nemeth G, Raicu DS, Rau AM, van Rikxoort EM, Rousson M, Rusko L, Saddi KA, Schmidt G, Seghers D, Shimizu A, Slagmolen P, Sorantin E, Soza G, Susomboon R, Waite JM, Wimmer A, Wolf I, Comparison and evaluation of methods for liver segmentation from CT datasets, IEEE transactions on medical imaging 28(8) (2009) 1251–65. [DOI] [PubMed] [Google Scholar]
- [24].Enquobahrie AA, Reeves AP, Yankelevitz DF, Henschke CI, Automated detection of small pulmonary nodules in whole lung CT scans, Academic radiology 14(5) (2007) 579–93. [DOI] [PubMed] [Google Scholar]
- [25].Reeves AP, Biancardi AM, Yankelevitz DF, Cham MD, Henschke CI, Heart region segmentation from low-dose CT scans: an anatomy based approach, SPIE Medical Imaging, SPIE, 2012, p. 9. [Google Scholar]
- [26].Couinaud C, Liver anatomy: portal (and suprahepatic) or biliary segmentation, Dig Surg 16(6) (1999) 459–67. [DOI] [PubMed] [Google Scholar]
- [27].Lewis S, Peti S, Hectors SJ, King M, Rosen A, Kamath A, Putra J, Thung S, Taouli B, Volumetric quantitative histogram analysis using diffusion-weighted magnetic resonance imaging to differentiate HCC from other primary liver cancers, Abdom Radiol (NY) (2019). [DOI] [PubMed] [Google Scholar]
- [28].Edmondson HA, Steiner PE, Primary carcinoma of the liver: a study of 100 cases among 48,900 necropsies, Cancer 7(3) (1954) 462–503. [DOI] [PubMed] [Google Scholar]
- [29].Washington MK, Berlin J, Branton PA, Burgart LJ, Carter DK, Compton CC, Frankel WL, Jessup JM, Kakar S, Minsky B, Nakhleh RE, Vauthey JN, C.o.A.P. Members of the Cancer Committee, Protocol for the examination of specimens from patients with carcinoma of the intrahepatic bile ducts, Arch Pathol Lab Med 134(4) (2010) e14–8. [DOI] [PubMed] [Google Scholar]
- [30].Bedossa P, Poynard T, An algorithm for the grading of activity in chronic hepatitis C. The METAVIR Cooperative Study Group, Hepatology 24(2) (1996) 289–93. [DOI] [PubMed] [Google Scholar]
- [31].Hamer OW, Aguirre DA, Casola G, Sirlin CB, Imaging features of perivascular fatty infiltration of the liver: initial observations, Radiology 237(1) (2005) 159–69. [DOI] [PubMed] [Google Scholar]
- [32].Bland JM, Altman DG, Measuring agreement in method comparison studies, Statistical methods in medical research 8(2) (1999) 135–60. [DOI] [PubMed] [Google Scholar]
- [33].Viera AJ, Garrett JM, Understanding interobserver agreement: the kappa statistic, Fam Med 37(5) (2005) 360–3. [PubMed] [Google Scholar]
- [34].R Core Team, R: A language and environment for statistical computing, R Foundation for Statistical Computing, Vienna, Austria, 2017. [Google Scholar]
- [35].El-Badry AM, Breitenstein S, Jochum W, Washington K, Paradis V, Rubbia-Brandt L, Puhan MA, Slankamenac K, Graf R, Clavien PA, Assessment of hepatic steatosis by expert pathologists: the end of a gold standard, Annals of surgery 250(5) (2009) 691–7. [DOI] [PubMed] [Google Scholar]
- [36].Chalian H, Tochetto SM, Tore HG, Rezai P, Yaghmai V, Hepatic tumors: region-of-interest versus volumetric analysis for quantification of attenuation at CT, Radiology 262(3) (2012) 853–61. [DOI] [PubMed] [Google Scholar]
- [37].Sullivan DC, Obuchowski NA, Kessler LG, Raunig DL, Gatsonis C, Huang EP, Kondratovich M, McShane LM, Reeves AP, Barboriak DP, Guimaraes AR, Wahl RL, Group R-QMW, Metrology Standards for Quantitative Imaging Biomarkers, Radiology 277(3) (2015) 813–25. [DOI] [PMC free article] [PubMed] [Google Scholar]
- [38].Jirapatnakul AC, Reeves AP, Biancardi AM, Yankelevitz DF, Henschke CI, Semi-automated measurement of pulmonary nodule growth without explicit segmentation, Biomedical Imaging: From Nano to Macro, 2009. ISBI ‘09. IEEE International Symposium on, IEEE; 2009, pp. 855–858. [Google Scholar]
- [39].Saba L, di Martino M, Bosco S, Del Monte M, de Cecco CN, Lombardo V, Piga M, Catalano C, MDCT classification of steatotic liver: a multicentric analysis, Eur J Gastroenterol Hepatol 27(3) (2015) 290–7. [DOI] [PubMed] [Google Scholar]
- [40].Yuan R, Mayo JR, Hogg JC, Pare PD, McWilliams AM, Lam S, Coxson HO, The effects of radiation dose and CT manufacturer on measurements of lung densitometry, Chest 132(2) (2007) 617–23. [DOI] [PubMed] [Google Scholar]