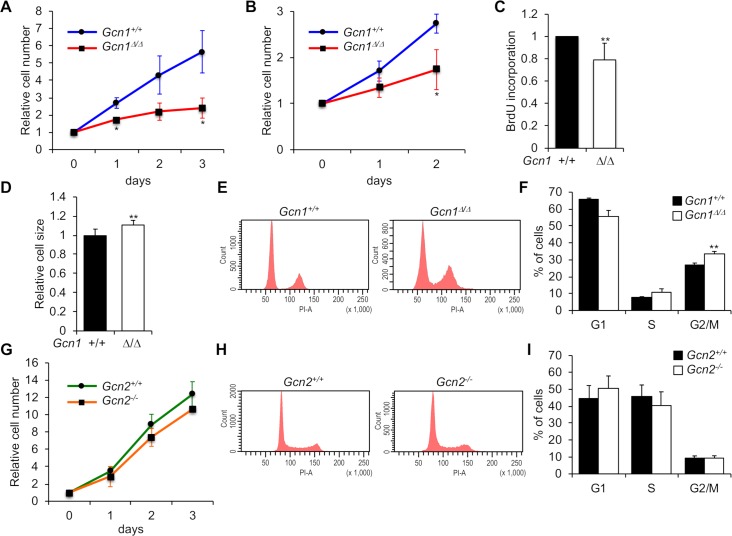
Fig 5. Gcn1ΔRWDBD MEFs exhibited reduced cell proliferation.
(A)(B)(G) After cells were cultured in IMDM for the indicated periods, the relative cell numbers of primary Gcn1ΔRWDBD MEFs (A), immortalized Gcn1ΔRWDBD MEFs (B) and immortalized Gcn2 KO (Gcn2-/-) MEFs (G) were counted and are shown with those of the corresponding WT (Gcn1+/+ or Gcn2+/+) cells. The initial cell number was set to 1 and the results are shown as the relative folds±SD from multiple independent experiments ((A): N = 6, (B): N = 4, (C): N = 3). * p<0.05, ** p<0.01 compared with the WT (two tailed Student’s t-test). (C) Cell proliferation in the primary WT (Gcn1+/+) and Gcn1ΔRWDBD MEFs was examined using BrdU incorporation. The results are presented as fold differences compared to the WT (Gcn1+/+) MEFs from multiple independent experiments (N = 6). ** p<0.01 compared with the WT (two tailed Student’s t-test). (D) Relative cell sizes in the primary WT (Gcn1+/+) and Gcn1ΔRWDBD MEFs were measured using forward light scatter (FSC) of flow cytometry. The results are presented as fold differences compared to the WT (Gcn1+/+) MEFs from multiple independent experiments (N = 7). ** p<0.01 compared with the WT (two tailed Student’s t-test). (E) The WT (Gcn1+/+) and Gcn1ΔRWDBD primary MEFs were stained by propidium iodide (PI) to assess the DNA contents in different phases of the cell cycle. The percentage of cells in each cell cycle was calculated (F). The results are presented as fold differences compared to those of the WT (Gcn1+/+) MEFs from multiple independent experiments (N = 5). ** p<0.01 compared with the WT (two tailed Student’s t-test). (H) WT (Gcn2+/+) and immortalized Gcn2 KO (Gcn2-/-) MEFs were stained by PI, and the percentage of cells in each cell cycle was calculated (I). Data are shown as means±SD from multiple independent experiments (N = 4).

