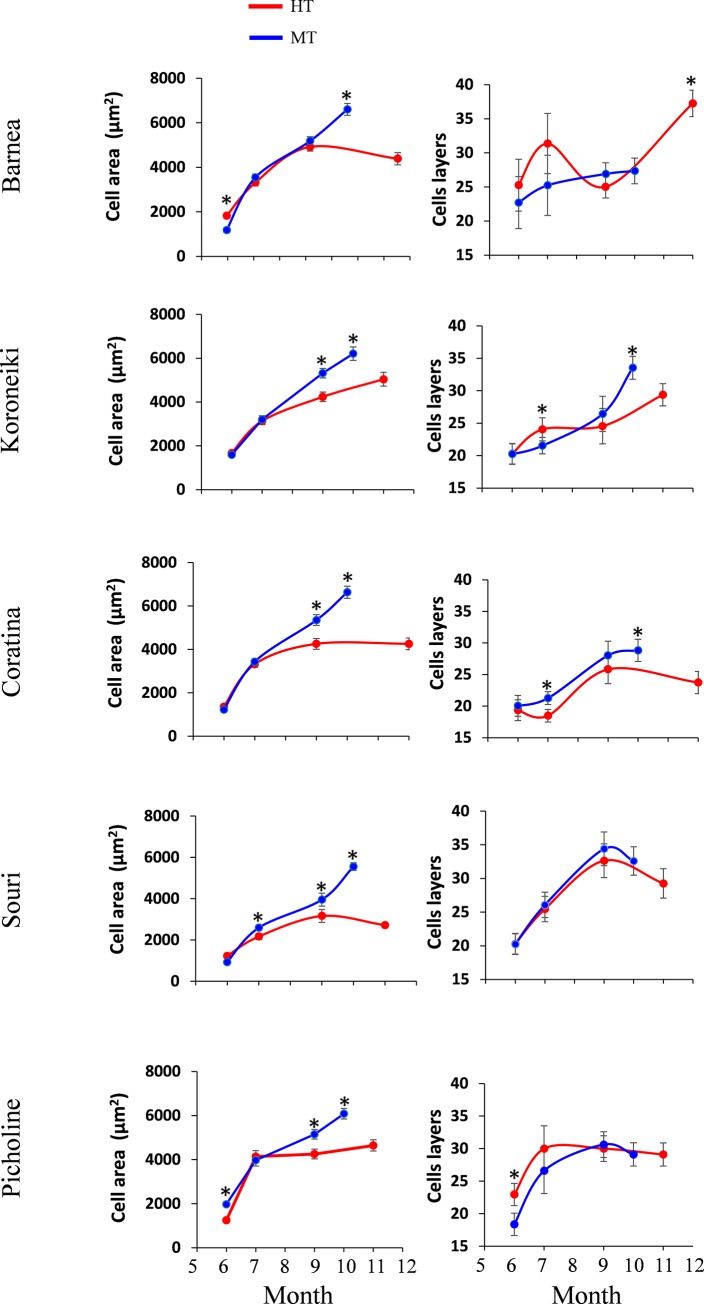
Fig 3. Mesocarp cell characterization in all 5 cultivars during 2017.
Quantification of the average cell area and the number of cell layers during the season (June, July, September and at harvest) are presented. Error bars represent confidence limits (α = 0.05). Asterisks represent significant difference (α = 0.05).

