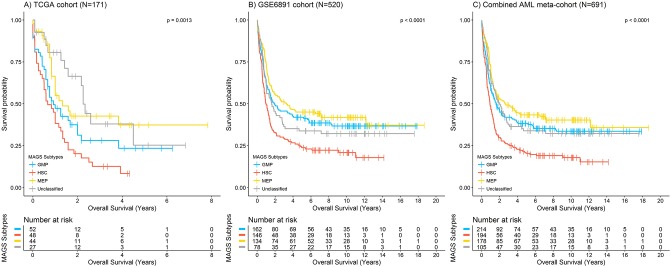
Fig 3. Prognostic validation of the assigned MAGS subtypes for (A) the TCGA-cohort (N = 171), (B) the GSE6892-cohort (N = 520), and (C) the associated meta-cohort (N = 691), using a frequency cut-off of 85% for MAGS assigned and 15% for samples assigned as unclassified.
Kaplan Meier survival curves were generated for overall survival and P-values were estimated using a log-rank test. Only samples with complete survival information were included and the number at risk per MAGS subtype are provided for each cohort.

