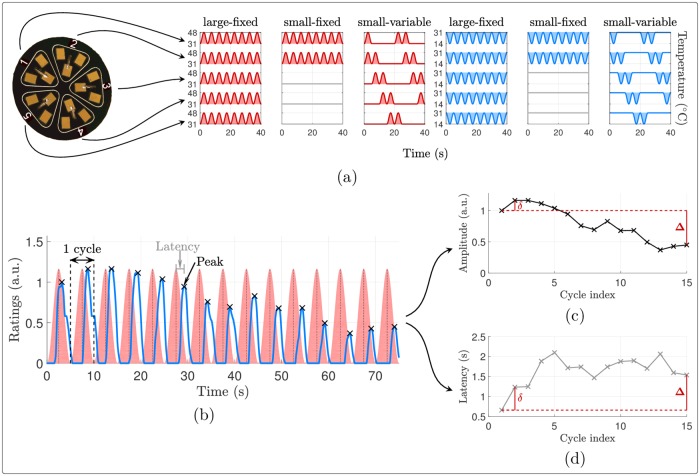
Fig 1. Stimulation employed and intensity ratings collected.
(a) Stimulation surface of the Thermal Cutaneous Stimulator (TCS) employed and stimulation temperature profiles considered in Experiment 1, depicted in red (or blue) for the warm (or cool) stimuli and truncated to 40 seconds for readability. The temperature profiles of the small-fixed and small-variable conditions were also employed in Experiment 2. (b) Example of intensity ratings from one subject during one stimulus (warm large-fixed). The temperature waveform is shaded in red and the blue curve is the intensity rating. In each cycle of 5 seconds, the amplitude of the rating peak and its latency compared to the corresponding temperature peak were computed. (c-d) Definition of the first and final differences, denoted respectively by δ and Δ, of (c) the rating peaks amplitudes and (d) latencies along the cycles.

