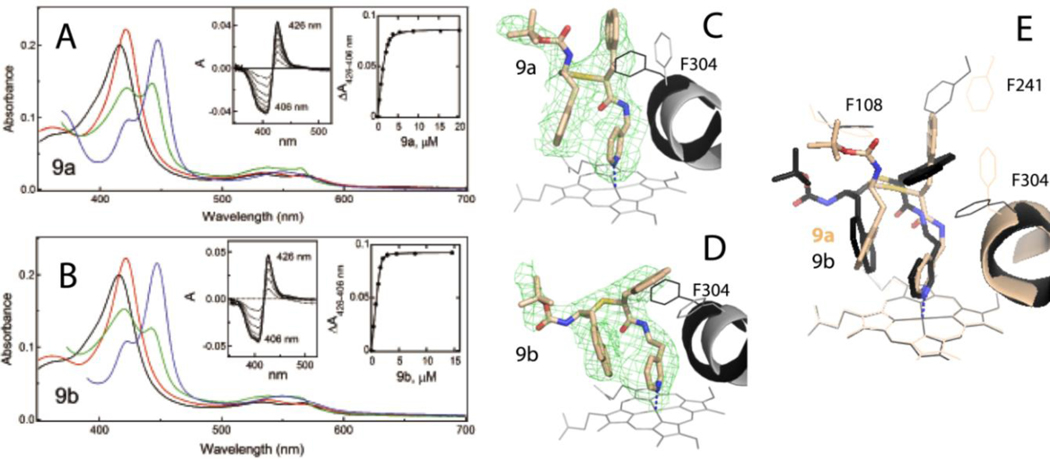
Figure 7.
A and B, Spectral changes in CYP3A4 induced by 9a-d, respectively. Absorbance spectra of oxidized ligand-free and ligand-bound CYP3A4 are in black and red, respectively. Spectra of ferrous ligand-bound CYP3A4 and its CO-adduct are in green and blue, respectively. Left insets are difference spectra recorded during equilibrium titrations. Right insets are titration plots with quadratic fittings. Spectral dissociation constants (Ks) derived from titration plots are listed in Table 1.
C and D, The binding mode of 9a and 9b (PDB ID 6UNL and 6UNM, respectively). The adjacent I-helix and F304 in the inhibitory complexes and water-bound CYP3A4 (4I3Q structure) are shown in gray and black, respectively. Polder omit maps contoured at 3 σ level are shown as green mesh. The CYP3A4-9b complex was crystallized in a distinct space group (Table S2) with two molecules per asymmetric unit; the better-defined molecule A was used for structural comparison.
E, Superposition of the 9a/b-bound CYP3A4.

