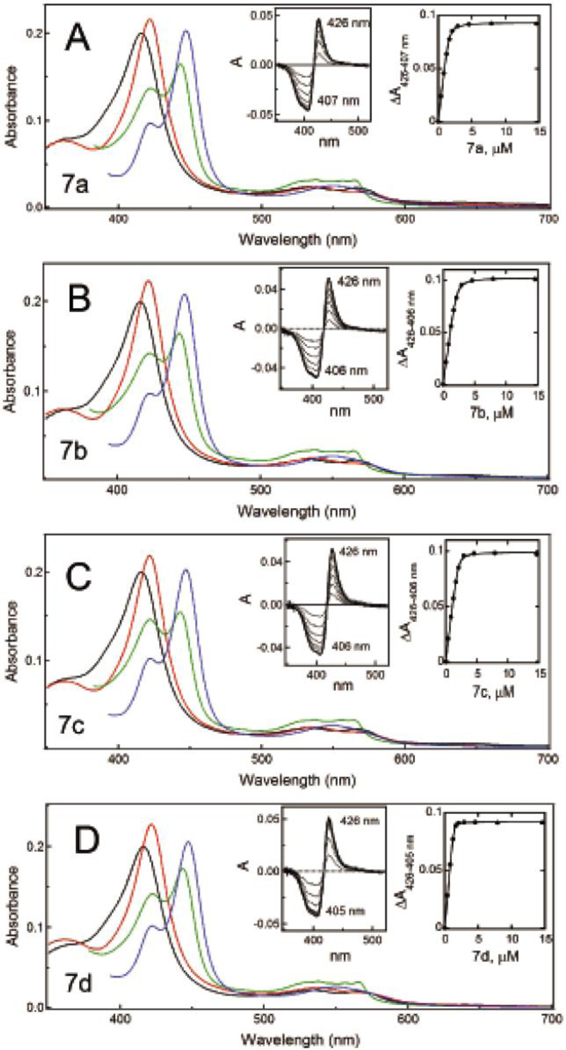
Figure 4.
A-D, Spectral changes in CYP3A4 induced by 7a-d, respectively. Absorbance spectra of oxidized ligand-free and ligand-bound CYP3A4 are in black and red, respectively. Spectra of ferrous ligand-bound CYP3A4 and its CO-adduct are in green and blue, respectively. Left insets are difference spectra recorded during equilibrium titrations. Right insets are titration plots with quadratic fittings. Spectral dissociation constants (Ks) derived from titration plots are listed in Table 1.

