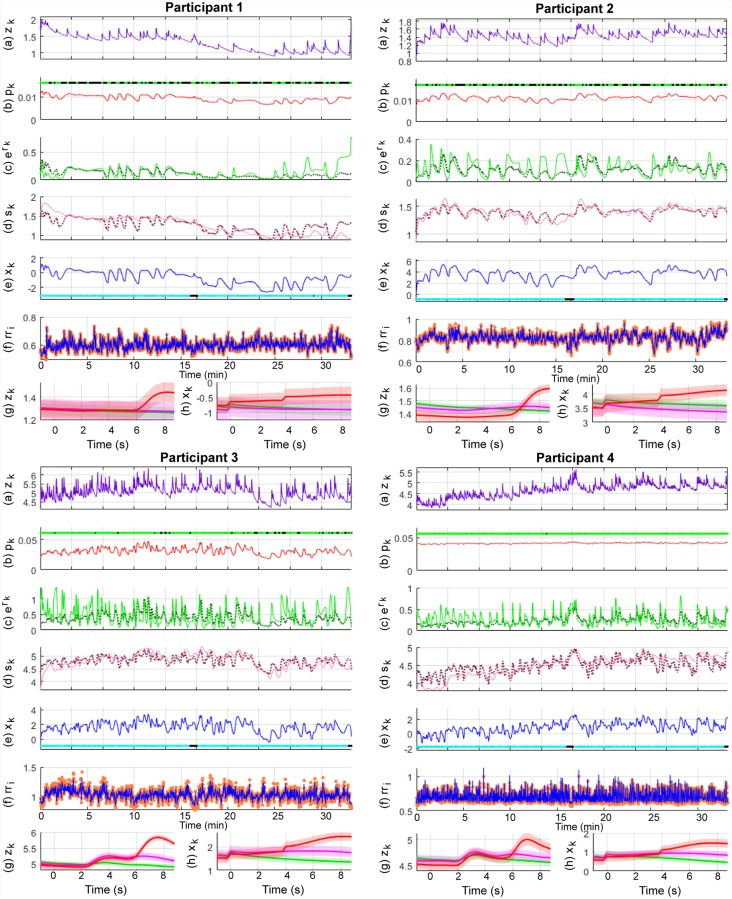
Fig 8. Sympathetic arousal estimation for participants 1-4 in the trace fear conditioning experiment.
The sub-panels from top to bottom respectively depict, (a) the skin conductance signal zk; (b) the presence or absence of SCR peaks (light green and black dots) and the smoothed Bernoulli trial probability estimates of pk (red line); (c) the exponent of the phasic derived signal rk (solid green line) and its estimate (dotted line); (d) the tonic part sk (solid light mauve line) and its estimate (dotted line); (e) the smoothed arousal state estimates of xk and the presence or absence of visual or electric stimuli (cyan and blacks dots); (f) the sequence of RR-intervals rri (orange dots) and the estimated RR-interval mean μ (solid blue line); (g) a 10 s ERP-like skin conductance plot for the CS- (green), CS+ without a shock (mauve—CS+US-) and CS+ with the shock (red—CS+US+) trials; (h) 10 s ERP-like arousal state plots along with their confidence intervals.

