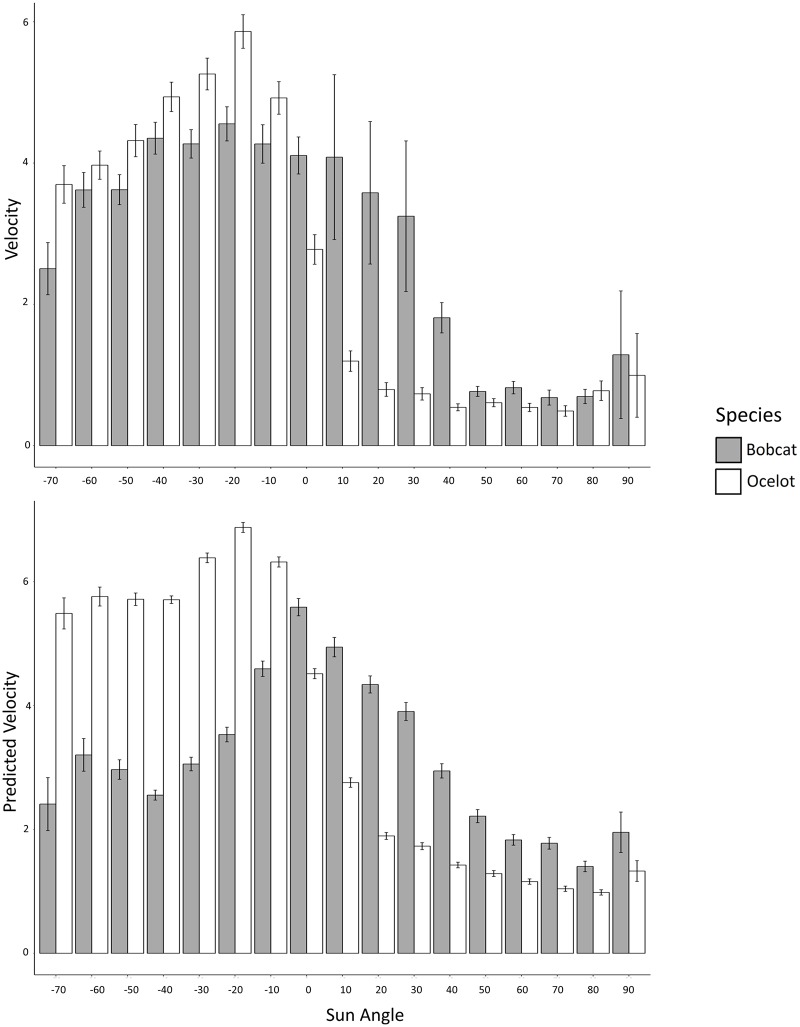
Fig 2. Actual and predicted movement velocity for ocelots and bobcats.
Velocity (m/hr.) values are averaged over 10° increments in Sun Angle. The top figure displays GPS-derived velocity values for ocelots and bobcats trapped on the East Foundation’s El Sauz Ranch between 2013 and 2017. The bottom figure displays accelerometer-derived Predicted Velocity values for ocelots and bobcats that were collared with Lotek Minitrack collars. Negative values of Sun Angle refer to degrees below the horizon and positive values refer to degrees above the horizon. Error bars represent standard error of the mean.

