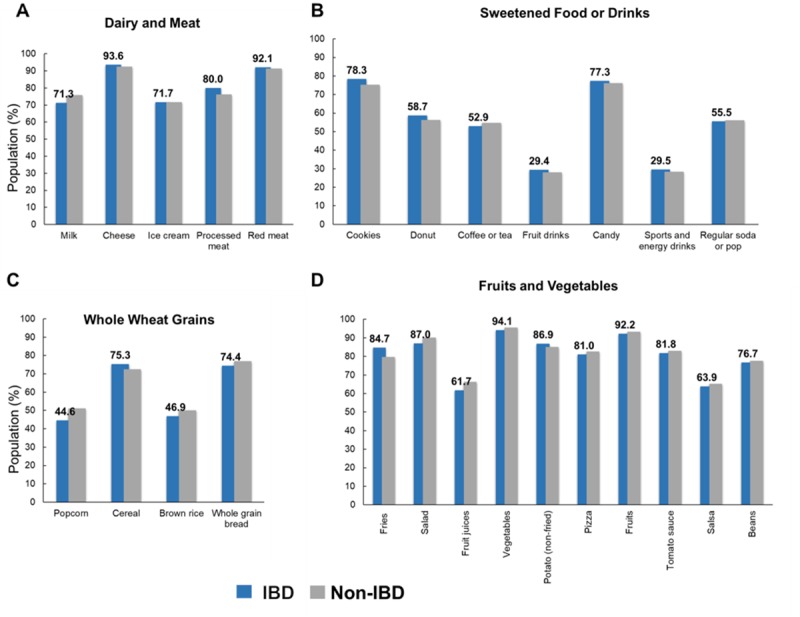
Fig 3. Comparison of weighted proportion of food intake between estimated US population with IBD and without IBD, NHIS 2015.

Values in panels A, B, C, and D reflect those of IBD population. *Asterisks indicate statistically significant difference (p-value < 0.05) when compared to estimated non-IBD population.
