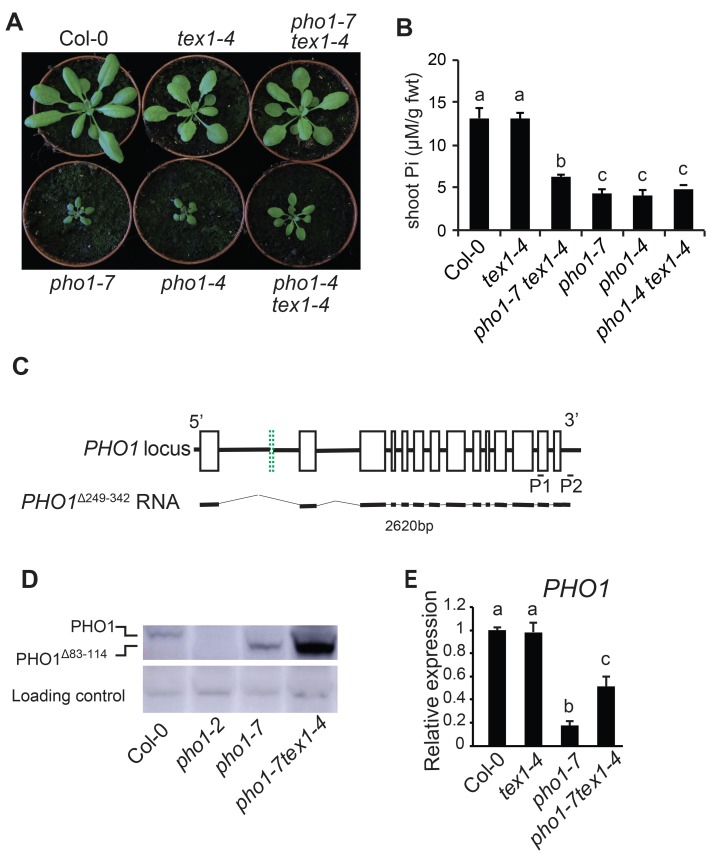
Fig 2. tex1 restores the expression of PHO1 in the pho1-7 mutant.
(A) Phenotype of 4-week-old Col-0, tex1-4, pho1-7, pho1-4, pho1-7 tex1-4 and pho1-4 tex1-4 mutants. (B) Shoot Pi contents of 4-week-old plants. Data from a representative experiment shows the means of Pi contents from six individual plants grown in independent pots. Error bars represent standard deviation. (C) Structure of truncated PHO1 mRNA produced at the PHO1 locus in the pho1-7 mutant. For the PHO1 locus, exons are indicated as black open boxes, except for the second exon, indicated as a green doted box. Exon 2 is present in Col-0 but deleted in the pho1-7 mutant as a result of T-DNA insertion. The structure of the mRNA PHO1Δ249–342 found in the pho1-7 mutant is shown below. The pairs of oligonucleotides P1 and P2 used for RT-PCR is shown. (D) Western blot showing full length and truncated PHO1 protein in roots of Col-0, pho1-2 null mutant, pho1-7 and pho1-7 tex1-4. Plants were grown for 4 weeks in a clay substrate and total protein were extracted from roots. (E) Relative expression level of PHO1 gene in the roots of 4-week-old plants grown in a clay substrate. Data are means of three samples from plants grown in independent pots and three technical replicates for each sample, with each sample being a pool of three plants. Error bars represent standard deviation. For both B and E, values marked with lowercase letters are statistically significantly different from those for other groups marked with different letters. (P < 0.05, ANOVA with the Tukey-Kramer HSD test).

