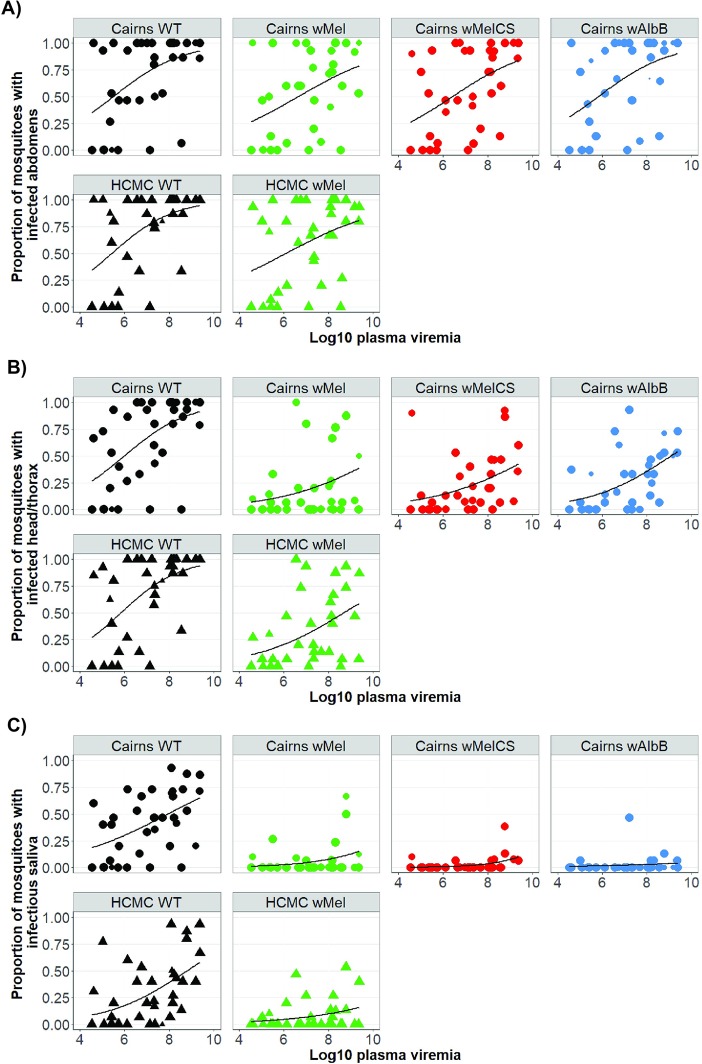
Fig 2. Proportion of mosquitoes from each of the six lines from each cohort with evidence of viral RNA in each tissue tested, after feeding indirectly on patient-derived viremic blood meals.
Each dot represents the proportion of each cohort that is infected, plotted as a function of log10 plasma viremia (RNA copies per milliliter). The size of the dot represents the number of mosquitoes tested in each cohort, up to a maximum of 15. Data are stratified by the Wolbachia infection status (where “WT” = uninfected, and the host genetic background of the mosquitoes). Figures show percentage of mosquitoes with an infection in A) abdomen tissue; B) head/thorax tissue; and C) naïve mosquitoes that were inoculated with saliva collected from index mosquitoes.

