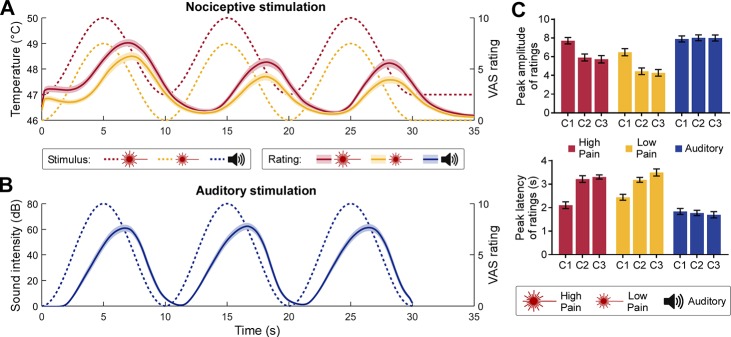
Fig 1. Rhythmic stimulus inputs and perceptual ratings.
(A) Nociceptive stimuli consisted of a 0.1-Hz sinusoidal modulation of skin temperature with a 3°C difference between peaks and troughs, lasting 30 seconds. Stimulation temperatures were adjusted for each participant (see Materials and methods). High-pain stimuli (dotted red line) were set to 1°C above the low-pain stimuli (dotted yellow line). In some conditions, participants (N = 30) were required to continuously rate their perceived pain intensity using a VAS ranging from 0 to 10. Both the high-pain (solid red line) and low-pain (solid yellow line) rating time courses followed the nociceptive input (shaded regions indicate the SEM across participants). (B) Auditory stimuli consisted of a 0.1-Hz sinusoidal modulation of the amplitude of a 280-Hz pure tone (dotted blue line). In some conditions, participants were required to continuously rate their perceived sound intensity (solid blue line). (C) Peak amplitude (top) and latency (bottom) of the intensity ratings. The peak latency is expressed as difference between a peak in the rating and the corresponding peak in the stimulus. Error bars indicate the SEM across participants. Data underlying these plots can be found in S1 Data. C1-C3, cycle 1 to 3; SEM, standard error of the mean; VAS, visual analogue scale.

