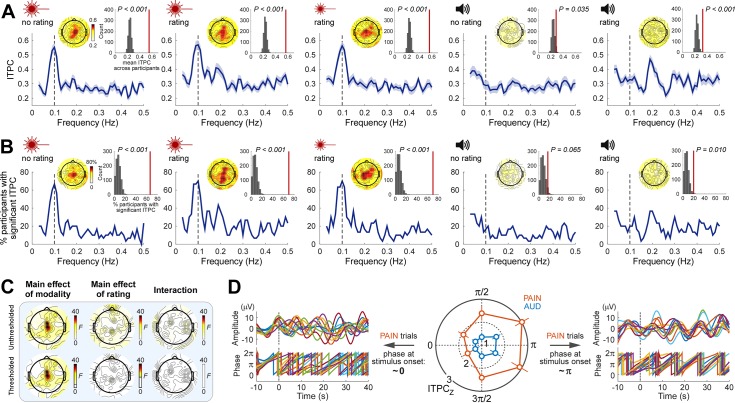
Fig 3. Rhythmic nociceptive input adjusts the phase of neural oscillations at stimulus frequency.
(A) ITPC averaged across participants (N = 30) as a function of frequency at central electrodes (blue lines; shaded regions indicate SEM across participants). Note that pain conditions show an ITPC peak at the stimulus frequency (0.1 Hz, vertical dashed line), whereas the auditory conditions do not. Insets show topographies of the ITPC at 0.1 Hz and the comparison of the 0.1-Hz ITPC from central electrodes (vertical red lines) to ITPC obtained from randomized data. (B) Percentage of participants with significant ITPC (Rayleigh’s test P < 0.05) as a function of frequency at central electrodes. Note the peak at 0.1 Hz during nociceptive but not auditory stimulation. Insets show topographies of the percentage of participants with a significant ITPC at 0.1 Hz and the comparison at central electrodes to the same percentage obtained from randomized data. (C) Topographies of F values from a two-way repeated-measures ANOVA exploring the effect of factors Modality and Rating on 0.1-Hz ITPC. Top row: F values; bottom row: thresholded F values (P < 0.05, FDR corrected across electrodes); nonsignificant regions are masked with white. (D) The degree of phase locking during nociceptive stimulation was dependent on the phase of prestimulus oscillations. The strongest phase locking occurred in trials in which the stimulus started around the trough (π rad) of ongoing oscillations (right: pain trials in the two bins around π from a representative individual), whereas the weakest phase locking occurred when the stimulus started around the peak (0 rad) of ongoing oscillations (left: pain trials in the two bins around 0 from the same individual). As the signals displayed in the left and right panels are subgroups of trials selected for having a certain prestimulus phase, the prestimulus phases shown in each panel are unavoidably aligned. Error bars indicate SEM across participants. Data underlying these plots can be found in S1 Data. FDR, false discovery rate; ITPC, intertrial phase coherence; SEM, standard error of the mean.

