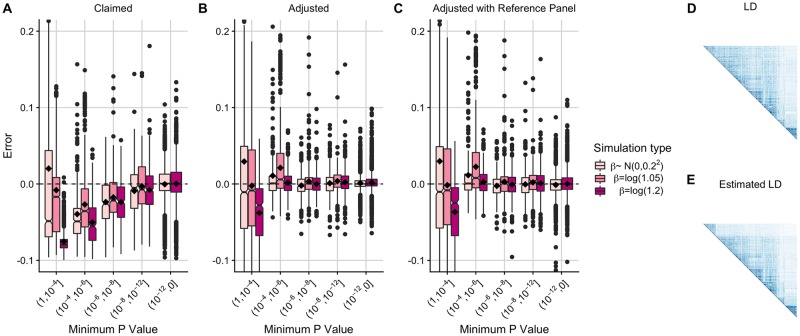
Fig 2. Error of conditional coverage estimates for 90% credible sets including using a reference panel to approximate MAFs and SNP correlations.
Box plots (median and IQR with mean marked by black diamond) of error in conditional coverage estimates from 5000 simulated 90% credible sets. Error is calculated as estimated conditional coverage–empirical conditional coverage and empirical conditional coverage is the proportion of 5000 additional simulated 90% credible sets that contain the causal variant. The two simulations with β = log(1.05) that were in the (10−12, 0] bin were manually removed as a box plot could not be formed. (A) Claimed coverage estimate (the sum of the posterior probabilities of causality for the variants in the credible set) (B) Adjusted coverage estimate using MAFs and SNP correlations from the original (1000 Genomes) data (C) Adjusted coverage estimate using UK10K data to approximate MAFs and SNP correlations (D) Graphical display of SNP correlations in 1000 Genomes data (E) Graphical display of the estimated SNP correlations using UK10K data.

