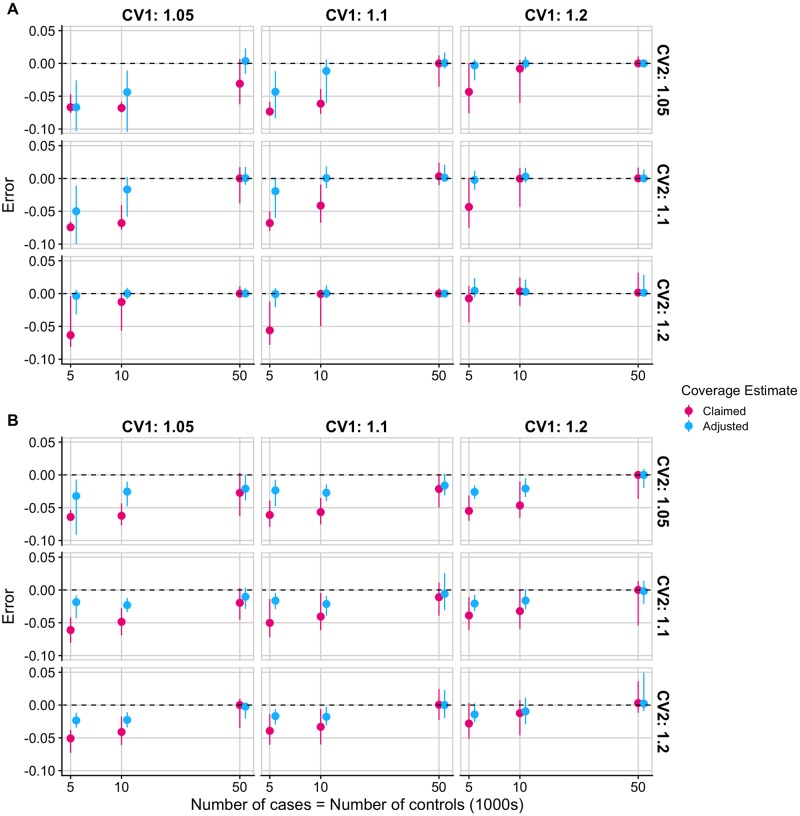
Fig 3. Error of conditional coverage estimates for 90% credible sets in regions with 2 causal variants.
Error is calculated as estimated conditional coverage–empirical conditional coverage where empirical conditional coverage is the proportion of 5000 additional simulated 90% credible sets that contain at least one of the 2 causal variants and estimated conditional coverage is the claimed or adjusted coverage estimate as defined in the text. The median error and interquartile range of claimed and adjusted coverage estimates of 90% credible sets from 5000 simulated regions with 2 causal variants that are (A) in low LD (r2 < 0.01) (B) in high LD (r2 > 0.7). Faceted by odds ratio values at the causal variants.

