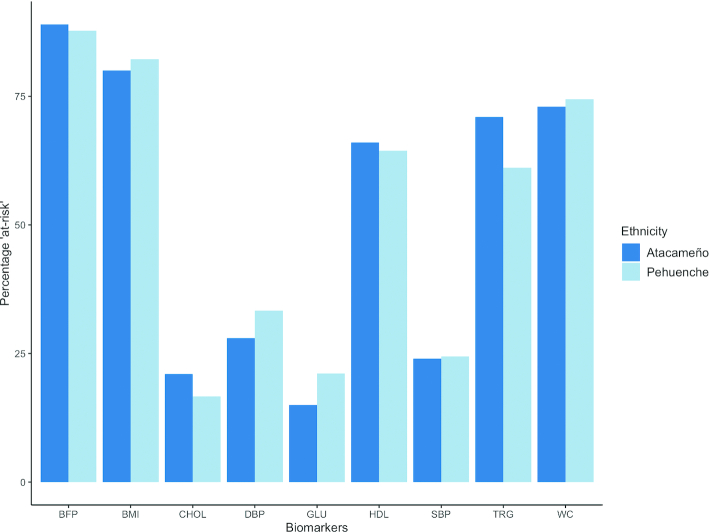
FIGURE 2.
Percentage of population “at-risk” for each biomarker by population. There were no statistically significant differences between the 2 groups at P < 0.05 for any biomarker. BFP, body fat percentage; CHOL, cholesterol; DBP, diastolic blood pressure; GLU, glucose; HDL, HDL cholesterol; SBP, systolic blood pressure; TRG, triglycerides; WC, waist circumference.

