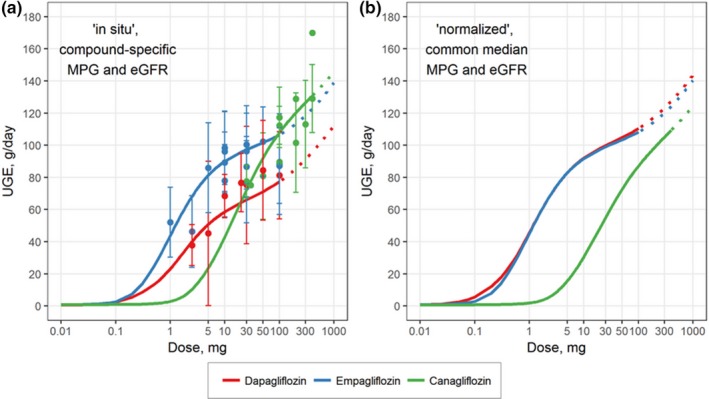
Figure 2.

Dose response of UGE (g/day) for type 2 diabetes mellitus patients treated with dapagliflozin (red), canagliflozin (blue), or empagliflozin (green). Model‐predicted UGE dose response for (a) the in situ scenario using the median MPG and eGFR calculated from all cohorts for each drug and (b) the normalized scenario in which the dose responses are based on the median MPG and eGFR calculated based on the pooled data set for all three drugs. Symbols, clinical data; curves, model‐predicted dose response. eGFR, estimated glomerular filtration rate; MPG, mean daily plasma glucose; UGE, urinary glucose excretion.
