Figure 5.

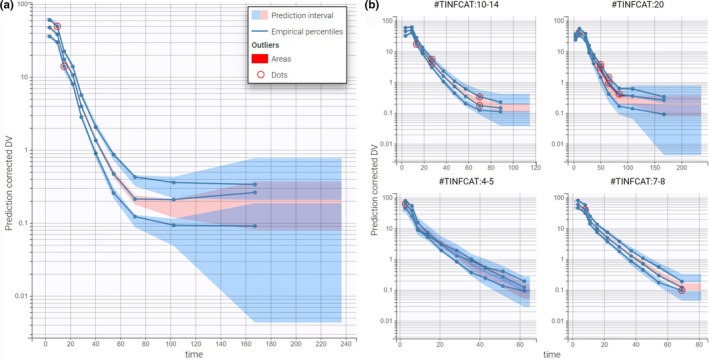
Final evaluation of the PK model. (a) Visual predictive check on the whole population. (b) Visual predictive check stratified by TINFCAT. DV, observed concentrations.

Final evaluation of the PK model. (a) Visual predictive check on the whole population. (b) Visual predictive check stratified by TINFCAT. DV, observed concentrations.