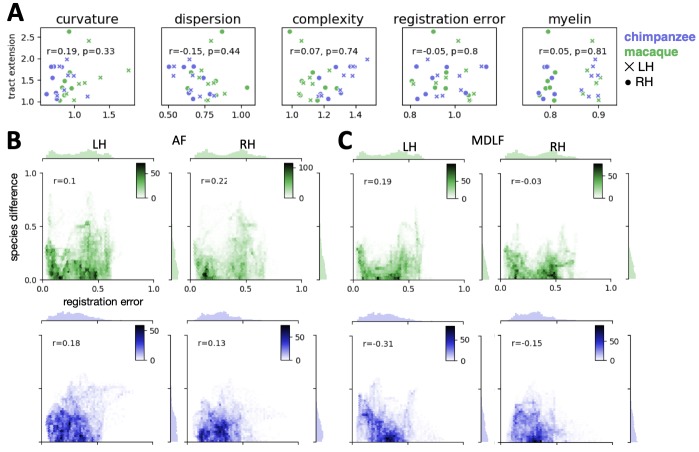
Appendix 4—figure 1. Related to Figure 5 and Appendix 3—figure 2.
(A) Tract-wise correlation of tract extension ratio and potentially confounding factors (n = 28). Labels for tracts are not provided for readability, but can be inferred from Appendix 3—figure 2. For details refer to the text. (B, C) Whole-brain vertex-wise correlation of absolute species difference in actual and predicted tract map (B: AF; C: MDLF) and the registration error map (i.e. one minus the myelin correlation map in Appendix 2—figure 1). Marginal histograms show the distribution of vertices across 50 regular bins. The inset scale shows the number of vertices within the bins of the joint distribution scatterplot (color mapping as in A), n = 20252 vertices, p<0.001 for all correlations in B and C.

