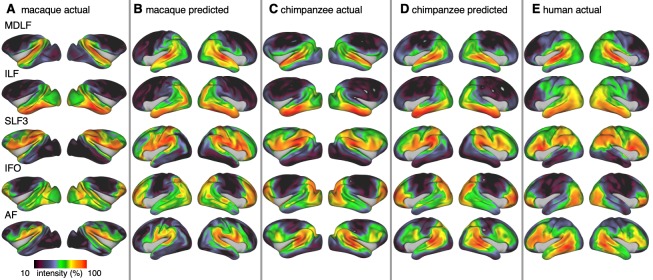
Figure 3. Actual and predicted tract maps.
The intensity in the tract maps reflects the probability of a tract’s termination on the cortical surface as derived from tractography. Actual tract maps of macaque (A), chimpanzee (C) and human (E). B and D show the tract maps in human space, predicted by the myelin-based registration for macaque and chimpanzee.

