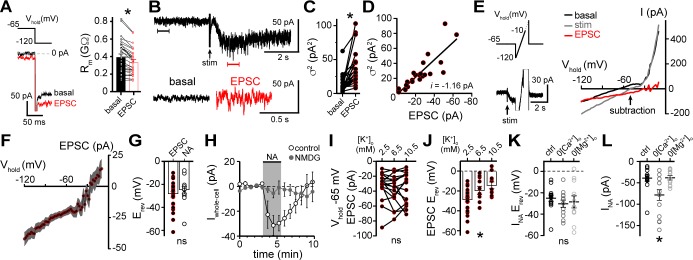
Figure 2. α1-adrenergic receptor-dependent inward current is carried by sodium entry.
(A) Membrane resistance (Rm, ΔV −65 to −120 mV) decreased during the α1-AR-EPSC indicating an opening of ion channels, as shown in an example trace (left) and in grouped data (right, p<0.0001, n = 31). (B) Representative trace of membrane noise during the α1-AR-EPSC, brackets denote segments shown below on an expanded scale. (C) Membrane noise (variance, σ2) increased during the α1-AR-EPSC (p<0.0001, n = 22). (D) Plot of α1-AR-EPSC variance versus mean amplitude, linear fit represents mean unitary current (i, r2 = 0.713, p<0.0001). (E) Slow voltage ramps (1 mV/10 ms, analyzed from −120 to −10 mV) were used to determine the current-voltage relationship of the α1-AR-EPSC (subtraction), determined by subtracting current at the peak of the α1-AR-EPSC (stim) from current measured in control conditions just prior to stimulation (basal). Current generated during ramps were truncated for clarity. (F) Current-voltage relationship of the α1-AR-EPSC from grouped data. Shaded area represents mean ± SEM. (G) Plot of reversal potentials (Erev) of the α1-AR-EPSC and INA (p>0.999, n = 26 and 14). (H) Replacing 126 mM NaCl with NMDG eliminated inward INA, shown in a time-course plot (Vhold−65 mV, p<0.0001, n = 14 and 13). (I) Plot of α1-AR-EPSC amplitudes measured at Vhold−65 mV, in 2.5, 6.5, and 10.5 mM [K+]o (p=0.162, n = 17). (J) Plot of α1-AR-EPSC reversal potential (Erev) with varying concentration of external K+ ([K+]o), demonstrating a depolarizing shift in Erev as external K+ was increased (p=0.010, n = 26, 10, and 11). (K) Plot of reversal potentials (Erev) of INA, demonstrating no significant difference between control conditions (ctrl), and after removal of external Ca2+ (0[Ca2+]o, p=0.49, n = 14 and 12) or Mg2+ (0[Mg2+]o, p=0.73, n = 14 and 11). (L) Plot of the amplitude of INA (Vhold−65 mV) demonstrating an augmented INA amplitude in 0[Ca2+]o (p=0.017, n = 14), but not in 0[Mg2+]o, (p>0.9999, n = 11) as compared with control conditions (n = 14). Line and error bars represent mean ± SEM, * denotes statistical significance, ns denotes not significant.


