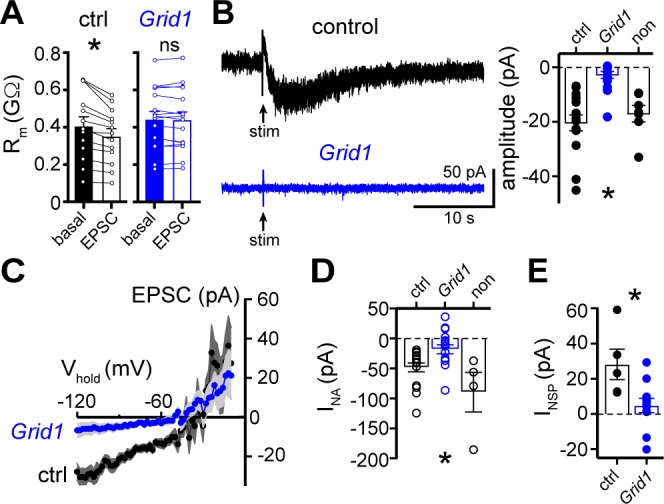
Figure 5. The α1-AR-EPSC is eliminated by targeting of GluD1R-channels via CRISPR/Cas9.
(A) Membrane resistance (Rm, ΔV −65 to −120 mV) decreased after stimulation in transduced neurons from mice injected with AAV-Cas9 and AAV-empty (ctrl, p=0.0002, n = 13), but not in transduced neurons from mice injected with AAV-Cas9 and AAV-Grid1 (Grid1, p=0.562, n = 16). (B) Representative traces (left) and grouped data (right, p<0.0001, n = 15 and 16 and 7) demonstrating the presence of an α1-AR-EPSC in transduced neurons from control mice, but not from Grid1 mice. Neighboring non-transduced neurons from mice injected with AAV-Cas9 and AAV-Grid1 (non) had an α1-AR-EPSC that was indistinguishable from transduced neurons from control mice (p>0.999). (C) Current-voltage relationship of the α1-AR-EPSC from control (n = 13) and Grid1 (n = 16) grouped data. Shaded area represents mean ± SEM. (D) Targeting GluD1R reduced the inward current to noradrenaline (NA, INA,30 μM) as compared to transduced neurons from control mice and neighboring non-transduced neurons (p=0.004, n = 16 and 16 and 4). Inward INA in non-transduced neurons from mice injected with AAV-Cas9 and AAV-Grid1 was similar to transduced neurons from control mice (p=0.631). (E) Targeting GluD1R reduced the tonic inward current revealed by bath application of NASPM (100 μM, INSP) as compared to transduced neurons from control mice (p=0.009, n = 5 and 11). Line and error bars represent mean ± SEM, * denotes statistical significance, ns denotes not significant.

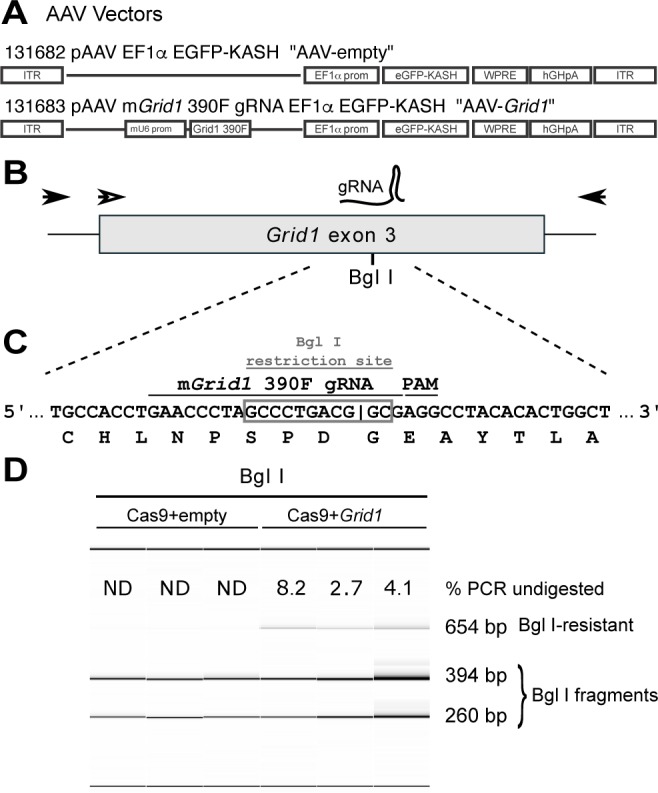
Figure 5—figure supplement 1. Design and testing of guide RNA targeting mouse Grid1.

