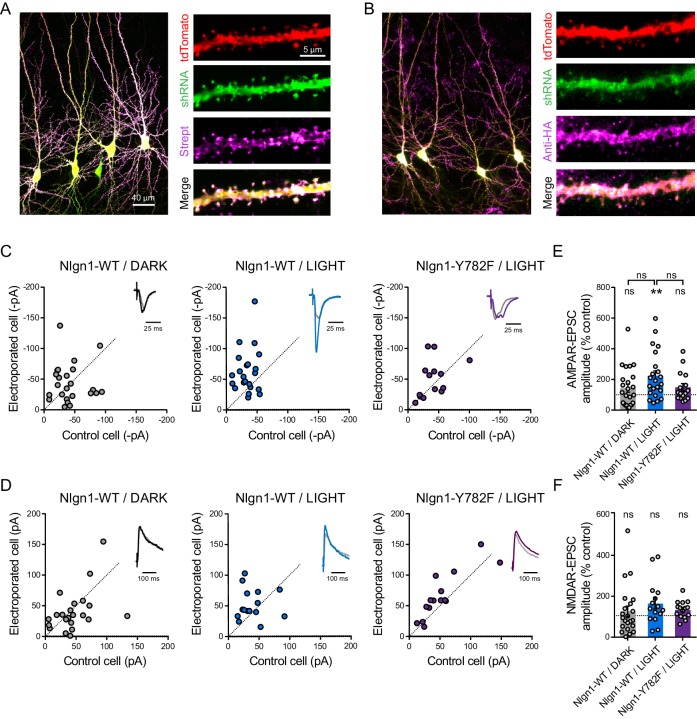
Figure 4. The light-induced increase in AMPA receptor-mediated EPSCs is specific to Y782 phosphorylation in Nlgn1.
CA1 Neurons were co-electroporated with plasmids encoding tdTomato, shRNA against endogenous Nlgn1 containing a GFP reporter, shRNA resistant AP-tagged Nlgn1-WT or -Y782F, biotin ligase (BirAER), and HA-tagged optoFgfr1. (A, B) Confocal images showing tdTomato (red) and GFP (green). Biotinylated Nlgn1 and optoFGFR1 were stained in different slices using streptavidin-Atto647 and anti-HA antibody, respectively (magenta). (C, D) Scatter plots of AMPAR- and NMDAR-mediated EPSCs, respectively, for electroporated versus paired non-electroporated neurons (control cell) in the indicated conditions. Representative traces (black, blue or violet) normalized to control (grey) are shown as insets. (E, F) Average of AMPAR-and NMDAR-mediated EPSCs, respectively, normalized to the control (100%) in the different conditions. Data were compared to the control condition by the Wilcoxon matched-pairs signed rank test and between themselves using one-way ANOVA followed by Tukey's multiple comparison (**p<0.01, ns: not significant).


