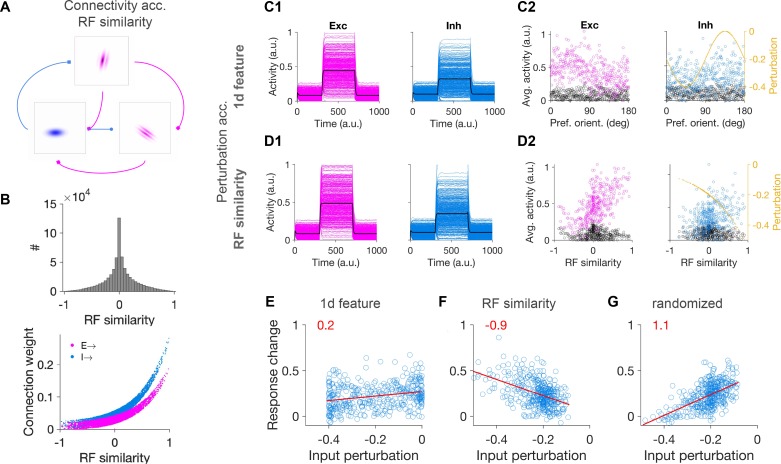
Figure 3. Patterned perturbation of inhibition based on receptive field similarity is necessary to reveal specific inhibitory stabilization.
(A) Sample neuronal RFs for excitatory (magenta) and inhibitory (blue) neurons and schematics of connectivity between neuronal pairs. (B) Upper: Distribution of RF similarity of all neuronal pairs in the network, as quantified by pairwise correlations of RFs. Lower: Weights of connections between neurons as a function of their RF similarity. (C1) Activity of excitatory and inhibitory neurons in response to patterned perturbation along the 1D dimension of orientation (similar to Figure 2A). (C2) The average activity of neurons during baseline and perturbed states, along with the profile of inhibitory perturbation, as a function of the preferred orientation of neurons (similar to Figure 2B). (D1,D2) Similar to (C1,C2) for patterned perturbation along RF similarity (see Materials and methods). The average activity of neurons in (D2) is plotted against the RF similarity of respective neurons to a reference inhibitory cell. (E) Response change of individual inhibitory neurons as a result of perturbation versus their respective input perturbations, along with the best fitted regression line (red), similar to (C). Patterned perturbation along the 1d feature of orientation does not reveal a negative slope, although it yields a nonspecific paradoxical effect (average increase of inhibition as a result of negative perturbations). (F) Patterned perturbation along RF similarity (with regard to a reference cell) shows the specific paradoxical effect (negative slope). (G) Same pattern of perturbation as in (F) but randomized over inhibitory neurons, does not lead to a specific paradoxical effect (lack of negative slope).


