. 2020 Feb 19;9:e52757. doi: 10.7554/eLife.52757

Figure 4. Patterned perturbation of specific ISNs according to response similarity.

(A) Left: RF similarity (quantified as pairwise RF correlation) of responsive inhibitory neurons in the network. Right: Response similarity of same inhibitory neurons, calculated as correlation of activity in response to a sequence of stimuli, composed of RFs with similar statistics as the neuronal RFs (see Materials and methods). Responsive units are identified as neurons with average activity more than the 20th percentile of the population and sorted according to their preferred orientation (PO sorted). (B) Marginal distribution of response similarity of all neuronal pairs in (A). (C) Response correlation of the neuronal pairs versus their RF correlation. (D) Response change of inhibitory neurons versus their input perturbation, when patterned perturbation is applied according to response similarity with regard to an example reference inhibitory cell. Red line shows the best fitted regression line and the slope is denoted in red. (E) The slope of the fitted regression line to the data points (as in (D)) for different inhibitory neurons used as the reference. Only significant regression lines (p-value<0.05) have been included. Negative slopes denote specific paradoxical effects. (F) Fraction of inhibitory neurons that would reveal a specific paradoxical effect (significant negative slope; red) or not (significant positive slope; black), if used as reference for delivering patterned perturbations.

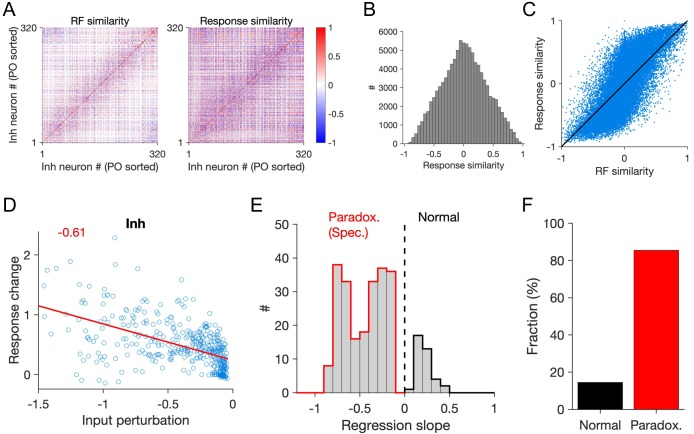
Figure 4.

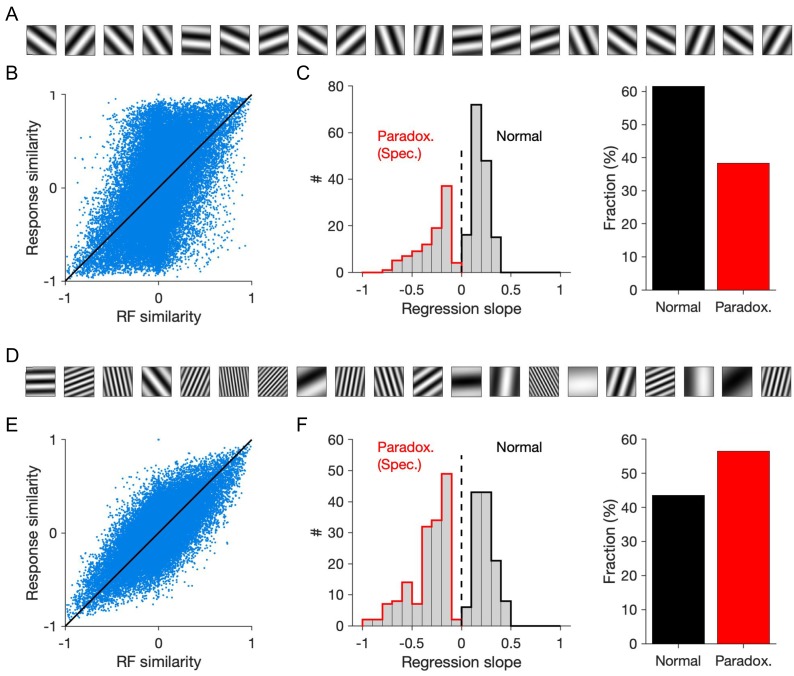
Figure 4—figure supplement 1. Patterned perturbation of specific ISNs according to response similarity when full-field gratings are used as stimuli.

Figure 4—figure supplement 1.

(A) Example stimuli used to probe the response similarity of inhibitory neurons. Full-field gratings with different orientation, but with a fixed spatial frequency (0.04 cpd), are interleaved with gray images, to measure the activity of neuronal networks. (B) Response correlation of neuronal pairs obtained from the responses to stimuli in (A) versus their RF correlations. (C) Left: Distribution of inhibitory neurons that would elicit significant negative regression slopes (specific paradoxical effect) or significant positive slopes, if the patterned perturbation is delivered according to response similarity with regard to them (similar to Figure 4E, but when stimuli as in (A) are used to probe neuronal responses). Right: Fraction of reference inhibitory neurons with specific paradoxical effects or normal. (D-F) Similar to (A-C) when stimuli with different orientations and a wide range of spatial frequencies (examples shown in (D)) are used to probe the neuronal responses and response similarities guiding patterned perturbations. Same as in Figure 4, all results are shown for responsive inhibitory neurons, identified as neurons with average activity of more than the 20th percentile of the population.
Figure 4—figure supplement 2. Feature-specific paradoxical effects obtained by perturbing inhibitory neurons based on their response similarity to natural images.

Figure 4—figure supplement 2.

(A) Example natural images used to probe the response similarity of inhibitory neurons. (B) Distribution of response similarity of responsive inhibitory neurons, when the network is stimulated with natural images (see Materials and methods). (C) Response similarity versus RF similarity. (D) Distribution of patterned perturbations based on reference inhibitory neurons leading to a significant negative slope (specific paradoxical effect; red) or not (significant positive slope; black). (E) Fraction of patterned perturbations (based on response similarity to reference inhibitory cells) leading to paradoxical effect or not. Other conventions are the same as Figure 4.