. 2020 Apr 7;9:e51712. doi: 10.7554/eLife.51712

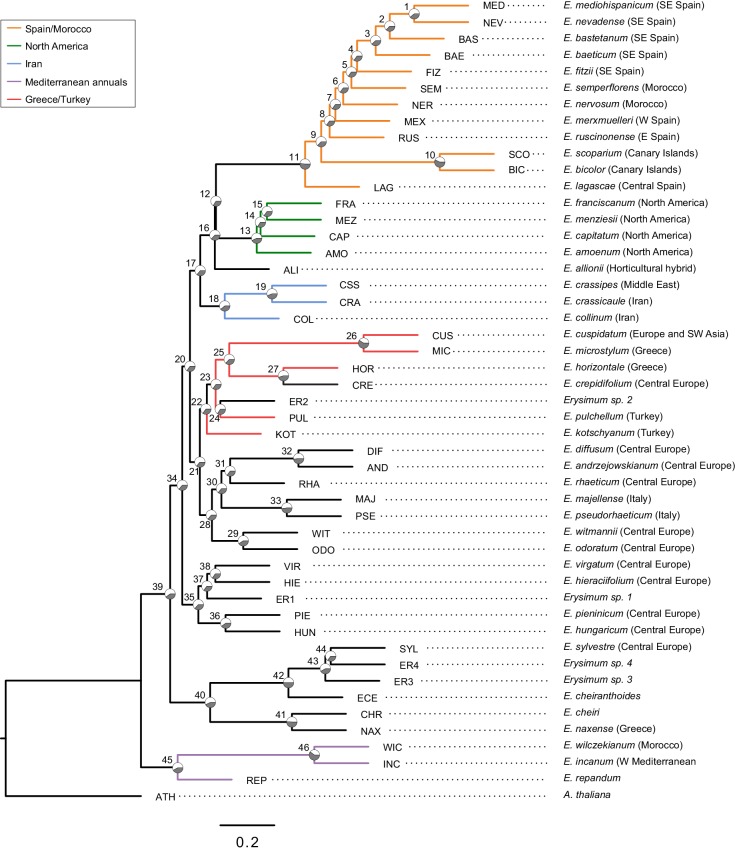
Figure 5. Genome-guided concatenated phylogeny of 48 Erysimum species.

Phylogenetic relationships were inferred from 9868 orthologous genes using ExaML with Arabidopsis thaliana as outgroup. Node depth corresponds to divergence time in million years. Pie charts on each internode show concordance factors, with gray segments corresponding to the proportion of gene tree supporting the main topology. Nodes are labelled as 1 to 47; see Supplementary file 5 for concordance factor values and number of decisive trees of each node. Four nodes were constrained using published divergence time estimates, with the range of constraints indicated by gray bars. Known polyploid species are highlighted in red. Approximate geographic range of species is provided in parentheses. The horticultural species E. cheiri and the weedy species E. cheiranthoides and E. repandum are of European origin but are now widespread across the Northern Hemisphere. Clades of species from shared geographic origins are highlighted in different colors. On the right, pictures of rosettes of a representative subset of species is provided to highlight the morphological diversity within this genus. Plants are of the same age and relative size differences are conserved in the pictures.

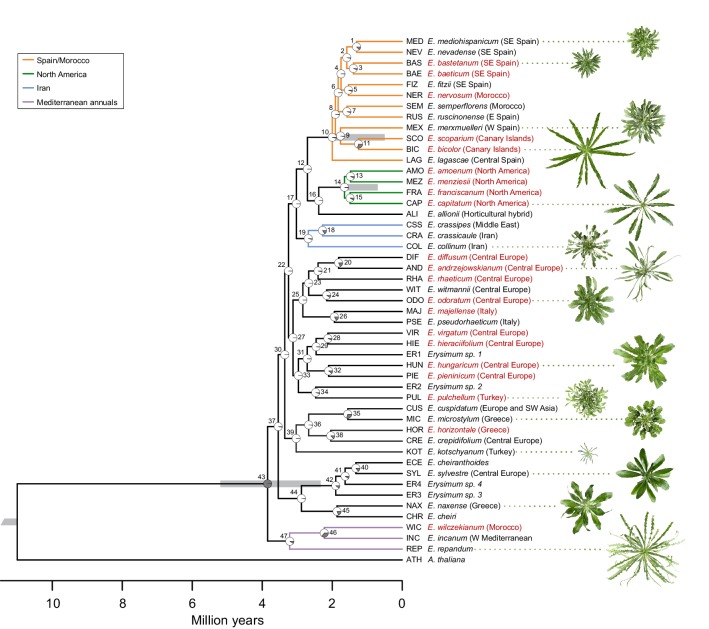
Figure 5.

Figure 5—figure supplement 1. Genome-guided ASTRAL phylogeny of 48 Erysimum species.

Figure 5—figure supplement 1.

Phylogenetic relationships were inferred from 9868 orthologous genes using ASTRAL-III with Arabidopsis thaliana as outgroup. Pie charts on each internode show proportional quartet support for the main topology (q1) relative to the first and second alternative. Note that maximal discordance is indicated by equivalent support for each alternative (1/3). Nodes are labelled as 1 to 46; see Supplementary file 4 for full quartet support values and local posterior probability scores. Terminal branch length was manually adjusted to 0.2 coalescent units.
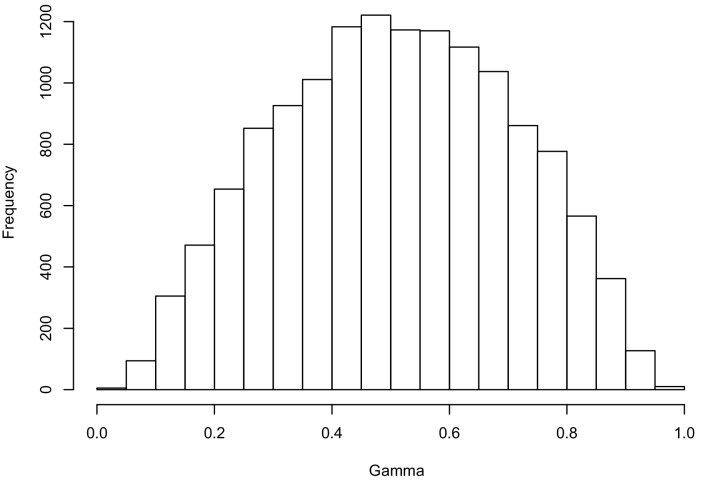
Figure 5—figure supplement 2. Hybridization levels among the 48 Erysimum species estimated by HyDe.

Figure 5—figure supplement 2.

The histogram shows the gamma score (hybridization proportion) distribution in all the significant detections (13,922 out of 51,888 tests after Bonferroni correction). Scores of 0.3 to 0.7 indicate high levels of hybridization.
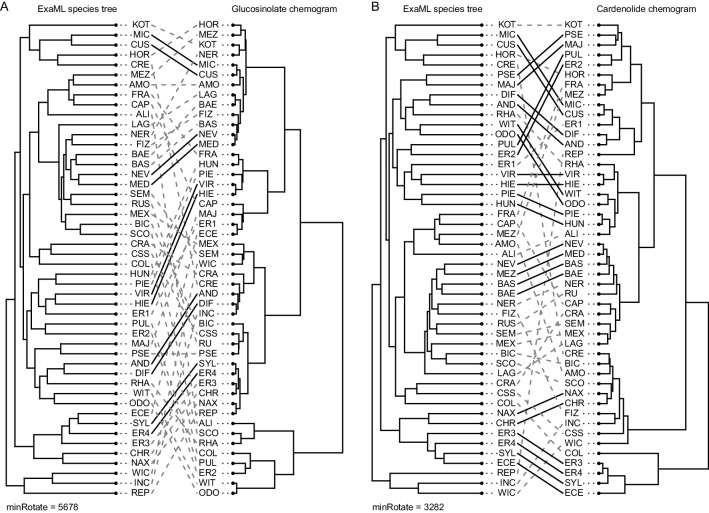
Figure 5—figure supplement 3. Co-phylogenetic plots of optimized matches between phylogenetic relatedness and chemical similarity in (A) glucosinolates and (B) cardenolides.

Figure 5—figure supplement 3.

Nodes on both the concatenated ExaML species tree and each chemogram were rotated to minimize tip-to-tip distances between trees. Dashed gray lines connect the same species in the phylogenetic trees and the chemograms. Solid black lines highlight species pairs for which the closest phylogenetic neighbor is also the most chemically similar species. MinRotate values correspond to the minimal total length of links between tree tips, with a perfect match between trees having a length of zero.
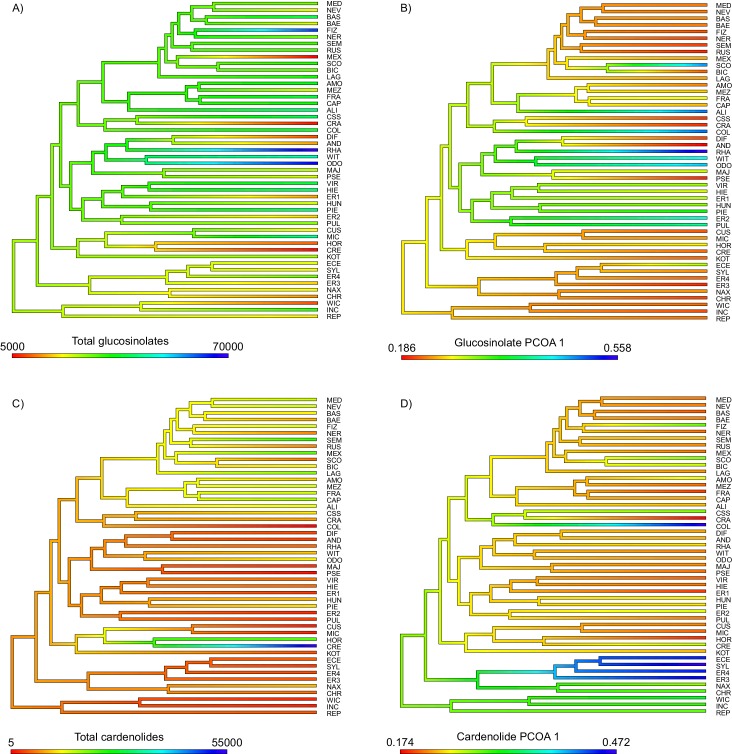
Figure 5—figure supplement 4. Ancestral state reconstruction of (A) total foliar glucosinolate content, (B) the first principal coordinate of the glucosinolate profile dissimilarity matrix, (C) total foliar cardenolide content, and (D) the first principal coordinate of the cardenolide profile dissimilarity matrix.

Figure 5—figure supplement 4.