. 2020 Apr 7;9:e51712. doi: 10.7554/eLife.51712

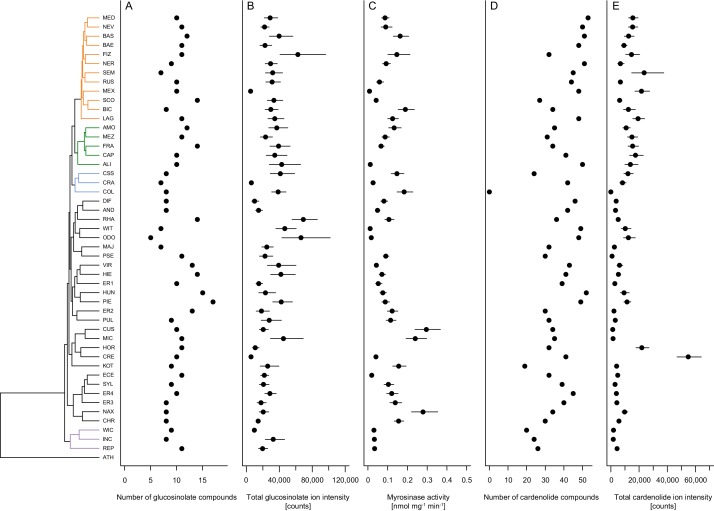
Figure 6. Mean defense traits of 48 Erysimum species, grouped by phylogenetic relatedness.

Not all traits could be quantified for all species. (A) Total number of glucosinolate compounds detected in each species. (B) Total glucosinolate concentration found in each species, quantified by total ion intensity in the mass spectrometry analyses. Values are means ±1 SE. (C) Quantification of glucosinolate-activating myrosinase activity. Enzyme kinetics were quantified against the standard glucosinolate sinigrin (2-propenyl glucosinolate) and are expressed per unit fresh plant tissue. Values are means ±1 SE. (D) Total number of cardenolide compounds detected in each species. (E) Total cardenolide concentrations found in each species, quantified by total ion intensity in mass spectrometry analyses. Values are means ±1 SE.

Figure 6—source data 1. Species means and standard errors (where applicable) for number of glucosinolate/cardenolide compounds, total compound concentrations, and myrosinase activity.

Figure 6.

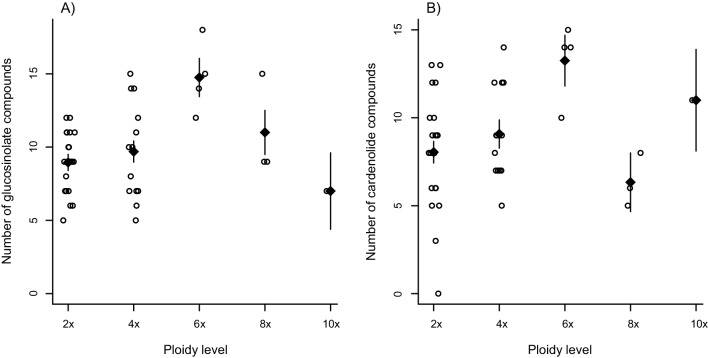
Figure 6—figure supplement 1. Effect of ploidy on compound diversity.

Figure 6—figure supplement 1.

Open circles correspond to species, with ploidy inferred from literature reports. Black triangles are mean values ± 1 SE for each ploidy level. (A) Total number of glucosinolate compounds produced by each Erysimum species. (B) Number of cardenolide compounds that together constitute 80% of total cardenolide concentrations. As many cardenolide compounds were produced at very low concentrations, an effect of ploidy was obscured if the total number of cardenolide compounds was considered.
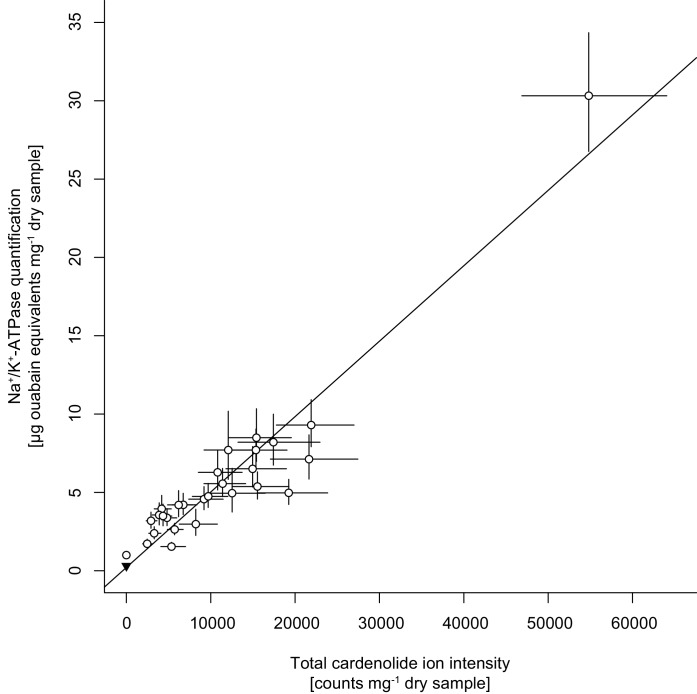
Figure 6—figure supplement 2. Correlation between cardenolide concentrations approximated by total cardenolide ion intensity and by inhibition of animal Na+/K+-ATPase.

Figure 6—figure supplement 2.

Open circles are species means ±1 SE. The black triangle in the bottom left corner is the quantification of Sinapis arvensis tissue as a negative control. The solid line is the linear regression on species means.