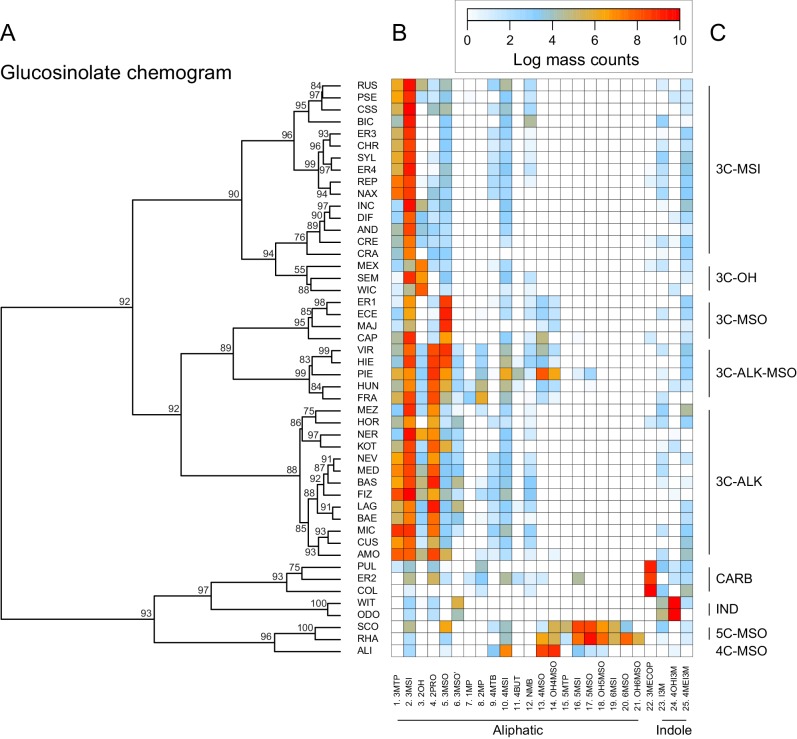
Figure 7. Glucosinolate compound diversity and abundance across 48 Erysimum species.
(A) Chemogram clustering species by dissimilarities in glucosinolate profiles. Values at nodes are confidence estimates (approximately unbiased probability value, function pvclust in R) based on 10,000 iterations of multiscale bootstrap resampling. (B) Heatmap of glucosinolate profiles expressed by the 48 Erysimum species. Color intensity corresponds to log-transformed integrated ion counts recorded at the exact parental mass ([M-H]-) for each compound, averaged across samples from multiple independent experiments. Compounds are grouped by major biosynthetic classes and labelled using systematic short names. See Supplementary file 6 for full glucosinolate names and additional compound information. (C) Classification of species chemotype based on predominant glucosinolate compounds. 3C/4C/5C = length of carbon side chain, MSI = methylsulfinyl glucosinolate, MSO = methylsulfonyl glucosinolate, OH = side chain with hydroxy group, ALK = side chain with alkenyl group, CARB = carboxylic glucosinolate, IND = indole glucosinolate.

