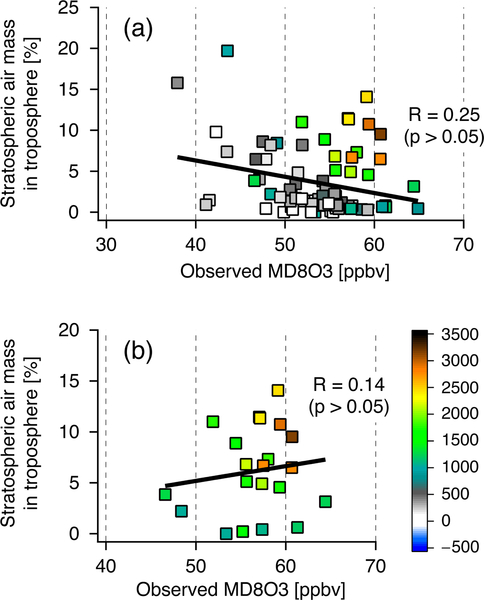
Figure 10.
Relationship between observed MD8O3 at the surface and the estimated stratospheric air mass contributed to total tropospheric O3 column as a monthly average during April 2010. The points are color coded based on elevation of each site. (a) All CAST-NET sites (except Alaska) and (b) elevated CASTNET sites defined as having an elevation greater than 1000m (see also Table S3).

