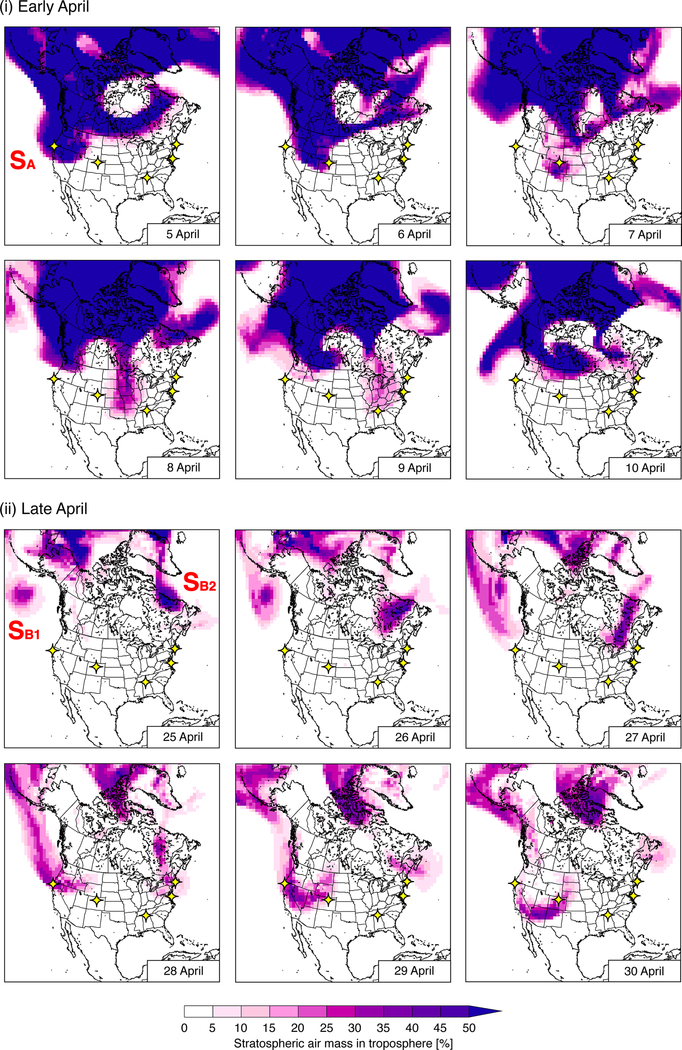
Figure 12.
Spatial distributions of day-to-day variations of stratospheric air mass contributions to total tropospheric O3 column over the US during (i) early and (ii) late April 2010. Yellow stars indicate the ozonesonde observational sites. Red character strings (SA and SB1 −SB2) denote the different stratospheric air masses discussed in the text.

