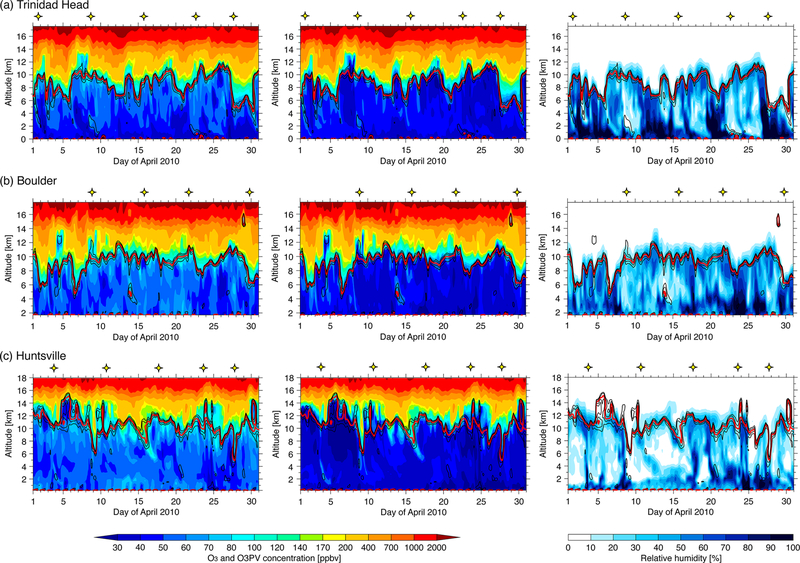
Figure 4.
Curtain plots of modeled (left) O3, (center) O3PV, and (right) RH at US ozonesonde sites of (a) Trinidad Head (CA), (b) Boulder (CO), and (c) Huntsville (AL) during April 2010. Yellow stars indicate the time of available ozonesonde measurements. Contour lines of modeled PV are also inserted for contours of 1.0, 1.5, 2.0, 2.5, and 3.0 PVU, with thick red lines denoting the 2.0 PVU contour as an index to diagnose the tropopause.

