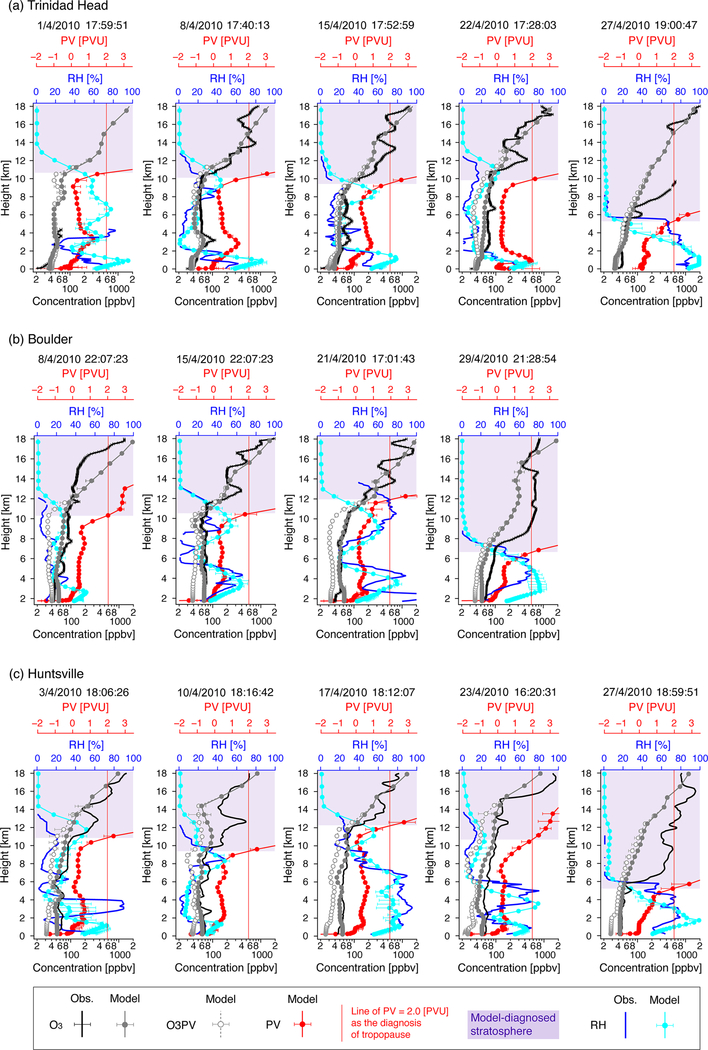
Figure 5.
Vertical profiles of observed and modeled O3 and RH at US ozonesonde sites of (a) Trinidad Head (CA), (b) Boulder (CO), and (c) Huntsville (AL). Also see Fig. 4 for ozonesonde measurement times. For modeled O3 and RH, the hourly result corresponding to the ozonesonde measurement time is shown by circles, and the maximum and minimum model results within ±2h of the measurement time are shown by whiskers. For observed O3 at Hilo and Boulder, the range of uncertainties of the O3 observations is shown by whiskers. Modeled O3PV and PV are also shown. Modeled PV profiles are plotted in red, and vertical lines corresponding to a PV value of 2 PVU are inserted as an index of the tropopause, and the layer range diagnosed as stratospheric air mass is colored in purple.

