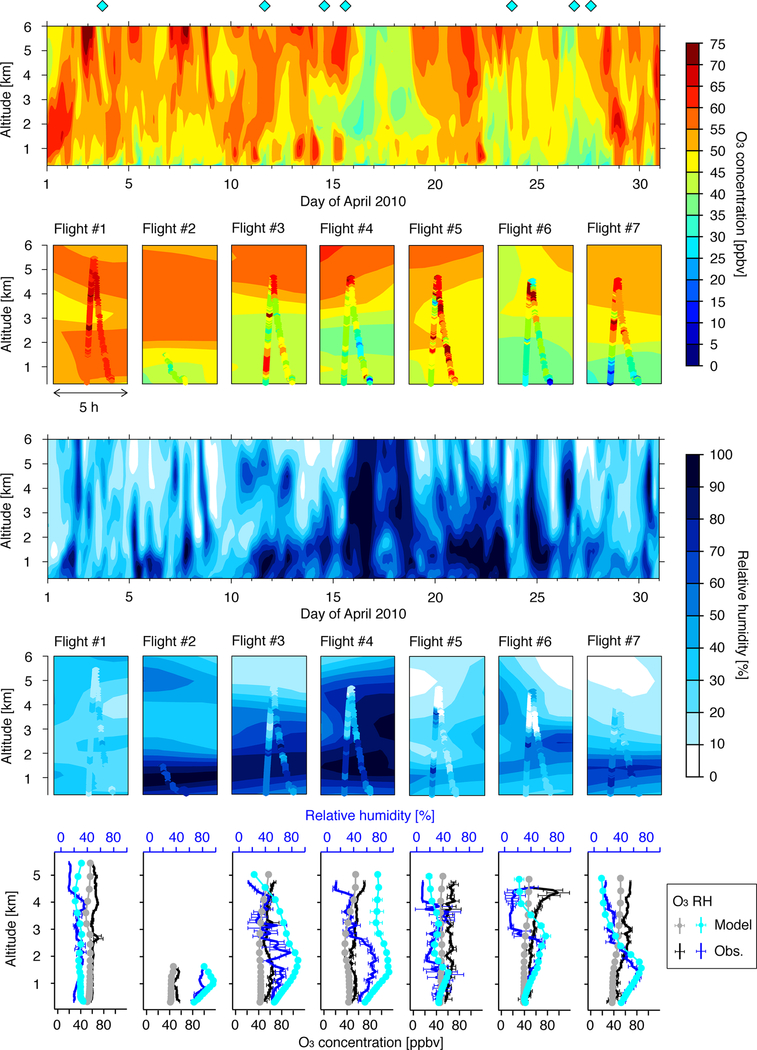
Figure 6.
Curtain plot and vertical profiles of O3 and RH at the aircraft observational site: Southern Great Plains, Oklahoma. Gray diamonds indicate the times of the seven aircraft flights, and results for these flights are shown in the expanded boxes for 5h time windows overlaid with observations. Observed ascent and descent profile data are averaged into 100m grid resolution, and profiles of the mean and standard deviations are shown. Modeled ascent and descent data corresponding to the observation times are averaged on original modeled layers, and the mean and standard deviations are shown.

