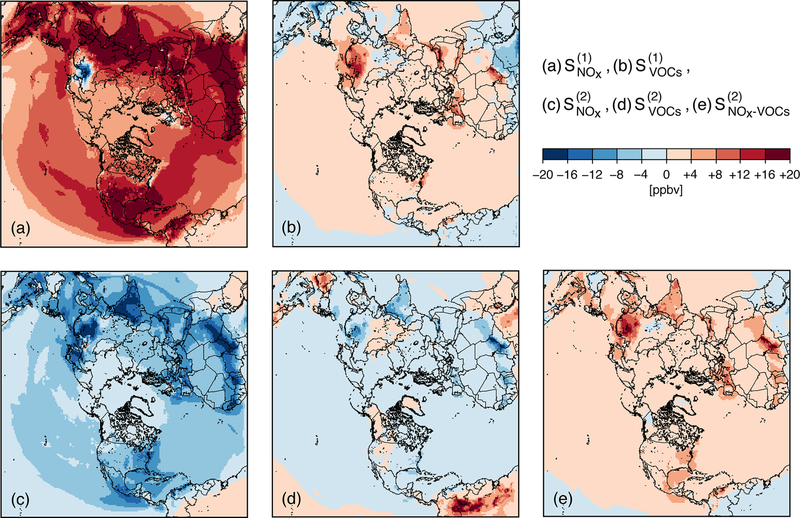
Figure 1.
Spatial distribution of the sensitivity coefficients of O3 to domain-wide emissions. (a) First-order sensitivity to NOx emissions, (b) first-order sensitivity to VOC emissions, panel (c) is the same as (a) but second order, panel (d) is the same as (b) but second order, and (e) second-order sensitivity to NOx and VOC emissions during April 2010. The sensitivity coefficients are monthly means computed from all hourly data on April 2010.

