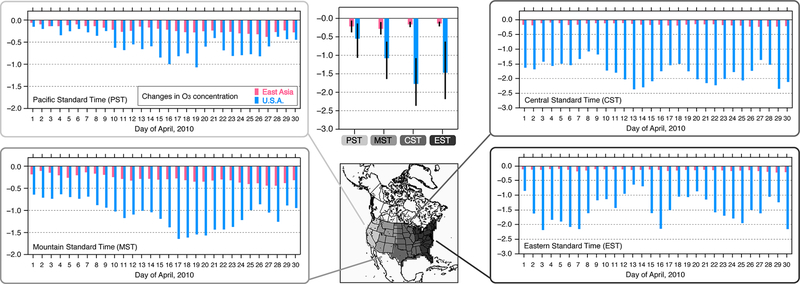
Figure 10.
Perspective of daily and monthly averaged changes in O3 mixing ratio resulting from estimated 2010–2015 emission changes over the US (light blue bars) and east Asia (light red bars) summarized over four time zones of Pacific, Mountain, Central, and Eastern Standard Time (PST, MST, CST, and EST) in the US. The units are ppbv. On a monthly average (center panel), whiskers indicate daily minimum and maximum. Note that the axis is different in the left (PST and MST) and right panels (CST and EST).

