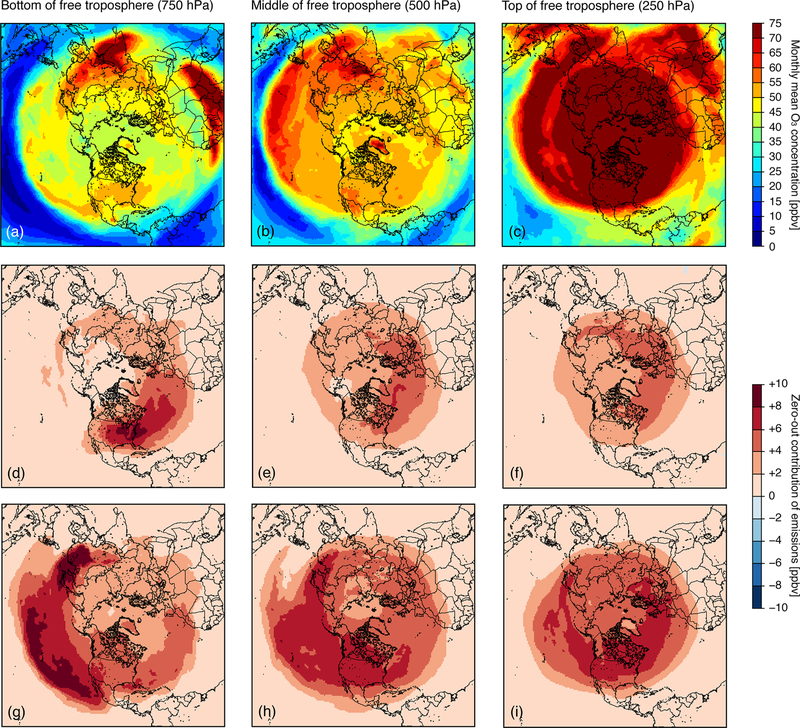
Figure 6.

Monthly averaged (a–c) O3 concentration and zero-out contribution from the (d–f) US and east (g–i) Asia at the bottom of free troposphere (750hPa; a, d, g), middle of free troposphere (500hPa; b, e, h), and top of free troposphere (250hPa; c, f, i).
