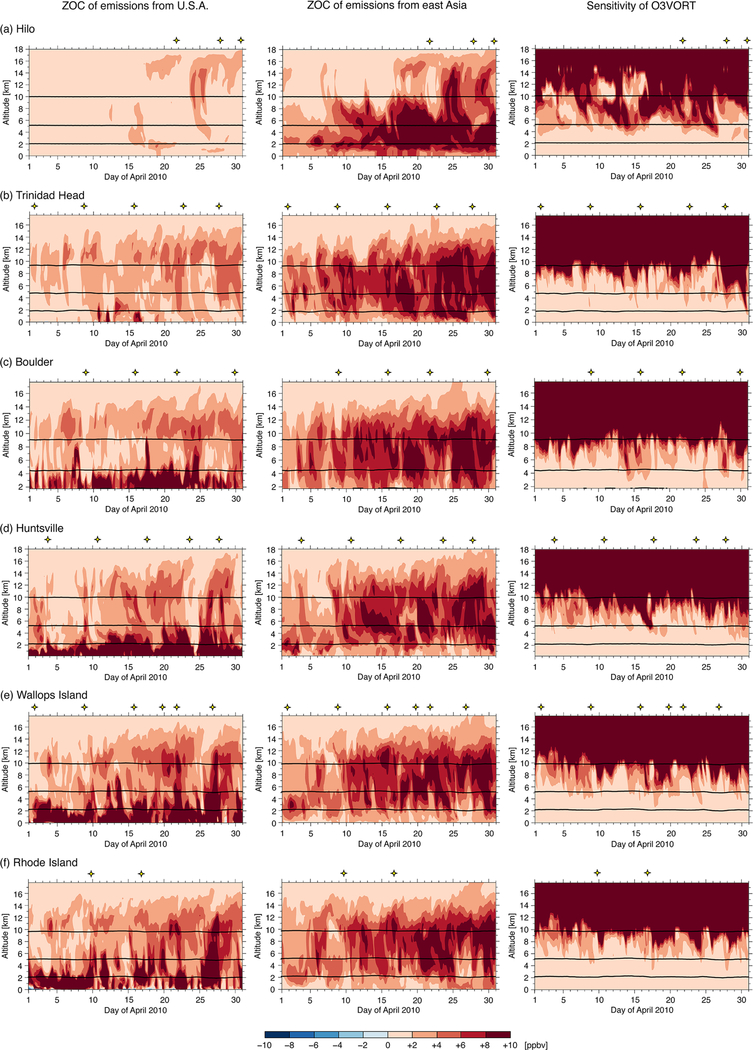
Figure 8.
Curtain plots of (left) ZOC of emissions from the US, (center) ZOC of emissions from east Asia, and (right) sensitivity of O3VORT at US ozonesonde sites of (a) Hilo (HI), (b) Trinidad Head (CA), (c) Boulder (CO), (d) Huntsville (AL), (e) Wallops Island (VA), and (f) Rhode Island during April 2010. Yellow stars indicate the time of available ozonesonde measurements. Thick lines from bottom to top indicate 750, 500, and 250hPa as a representative bottom, middle, and top of free troposphere.

