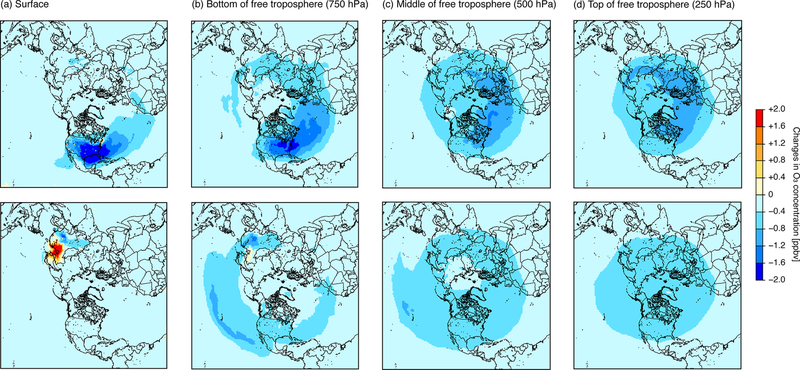
Figure 9.
Perspective of changes in O3 concentration resulting from estimated 2010–2015 emission changes over (top panels) the US and (bottom panels) east Asia at the (a) surface, (b) bottom of free troposphere (750hPa), (c) middle of free troposphere (500hPa), and (d) top of free troposphere (250hPa).

