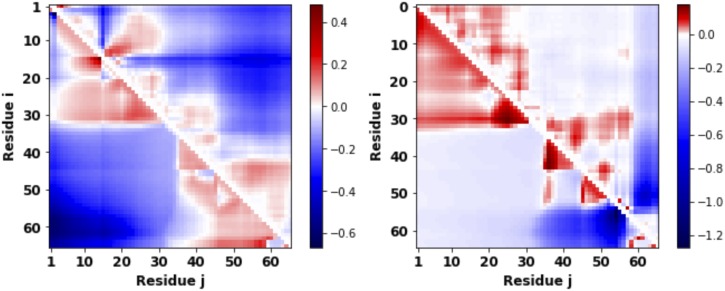
FIG. 3.
There are hotspots for phosphorylation. The difference in distance profiles (xij) quantified between two different phosphorylated forms [S2T15 (left) and S54S56 (right)] of the wild type protein P0A8H9 shows that there are specific sites for phosphorylation to induce drastic conformation changes at all scales. Positive (red) and negative (blue) differences are evident from the heat map. Theoretical results (lower triangle) agree well with the all-atom simulation (upper triangle).

