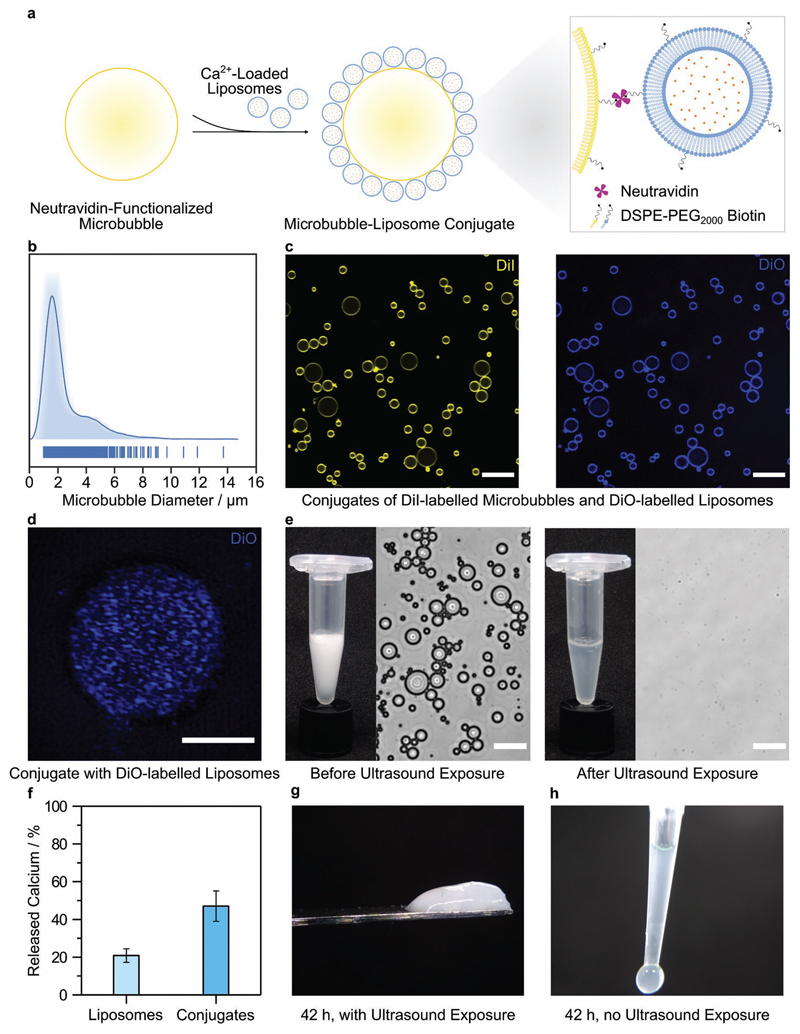
Figure 3. Ultrasound-triggered hydrogelation using calcium-loaded microbubble–liposome conjugates.
a) Schematic of the microbubble–liposome conjugation process, not to scale. b) Average-shifted histogram showing the diameter distribution of the microbubbles, as determined by image analysis of 890 microbubbles. The average diameter was measured as 2.5 ± 1.6 μm (mean ± standard deviation). c) Confocal fluorescence microscopy showing conjugates with fluorescence from both 1,1′-dioctadecyl-3,3,3′,3′-tetramethylindocarbocyanine (DiI)-labeled microbubbles (yellow) and 3,3′-dioctadecyloxacarbocyanine perchlorate (DiO)-labeled liposomes (blue). Scale bar: 20 μm. d) Super-resolution z-projection of DiO-labeled liposomes (blue) conjugated to the surface of a microbubble, obtained using structured illumination microscopy. Scale bar: 3 μm. e) Camera images and bright-field microscopy showing a turbid solution of intact microbubble–liposome conjugates before ultrasound exposure and a clear solution with no observable conjugates after ultrasound exposure (20 kHz, 25% duty cycle, 20% amplitude, 5 s). Scale bar: 20 μm. f) The percentage of calcium ions released from dose-matched liposomes and microbubble–liposome conjugates after ultrasound exposure (20 kHz, 25% duty cycle, 20% amplitude, 5 s) was measured using an o-CPC assay. Data are shown as mean and standard deviation of six technical replicates from the same batch of sonicated liposomes or microbubble–liposome conjugates. g) Image of a fibrinogen hydrogel formed after exposing calcium-loaded microbubble–liposome conjugates to ultrasound for 5 s. h) Image of an unexposed control, which remained liquid after 42 h.

